The short answer: log destinations are configured once under Log Settings → Callbacks — Langfuse, Datadog, Amazon S3, Google Cloud Storage, Slack, Athina, OpenMeter, or your own HTTP endpoint — and each one can be set to fire on success only, failure only, or both. Adding a destination and verifying its credentials with Test connection works today; automatic streaming of request logs is in Beta and is not delivering yet. Until it is, the live paths out are the Logs page CSV export and alert channels.
Nobody wants a second place to look. If AI traffic lands in a siloed dashboard that only the person who set it up ever opens, it is not observability — it is a tab. The reason to fan out at the gateway rather than in your application is that instrumenting every call site is exactly the toil a gateway exists to remove: you would wire Datadog into every service that calls a model, maintain it through every refactor, and still miss the calls made from a notebook or a cron job.
This guide does two things honestly. It sets up the destinations so they are correct and verified the day streaming turns on, and it shows the paths that move data today so you are not waiting on a Beta to answer a production question. Where a capability is not live yet, it says so — a roadmap item written in the present tense is how observability plans quietly become fiction.
Datadog, Langfuse, Athina, OpenMeter, Slack, Amazon S3 and Google Cloud Storage are trademarks of their respective owners. nRouter is not affiliated with or endorsed by them. Vendor claims below are sourced from their own documentation on the dates linked in
## Sources.
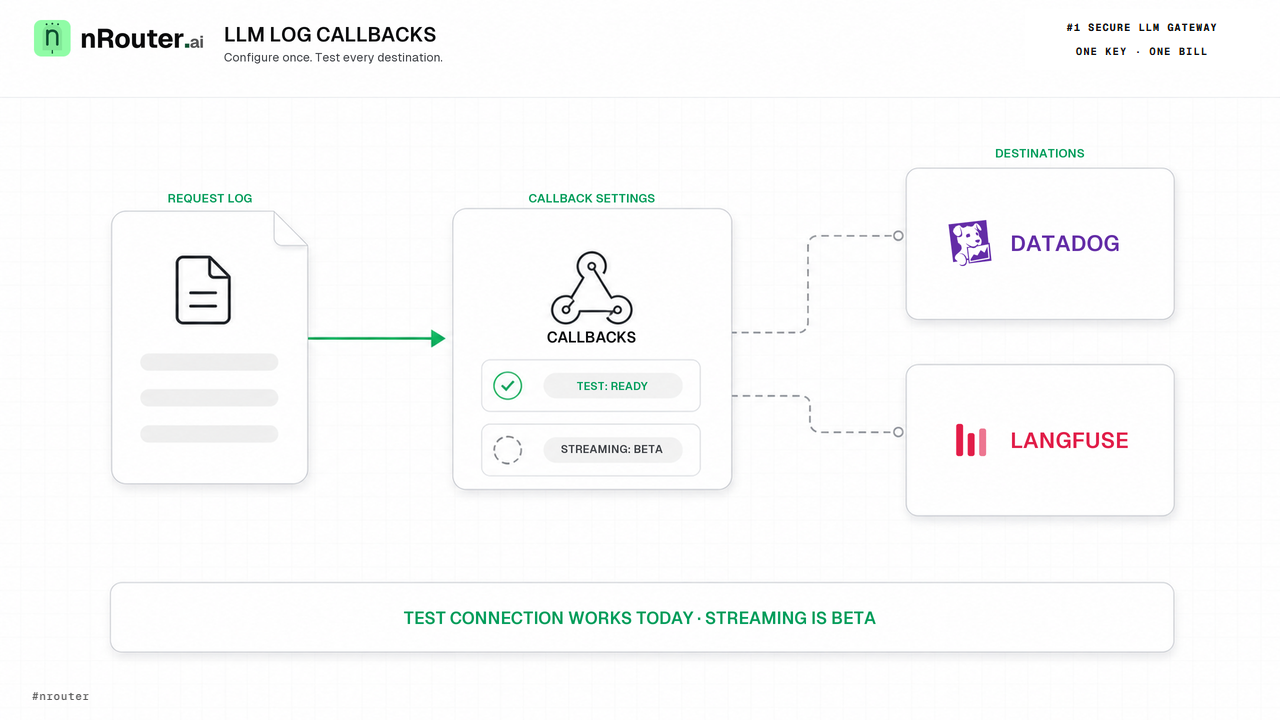
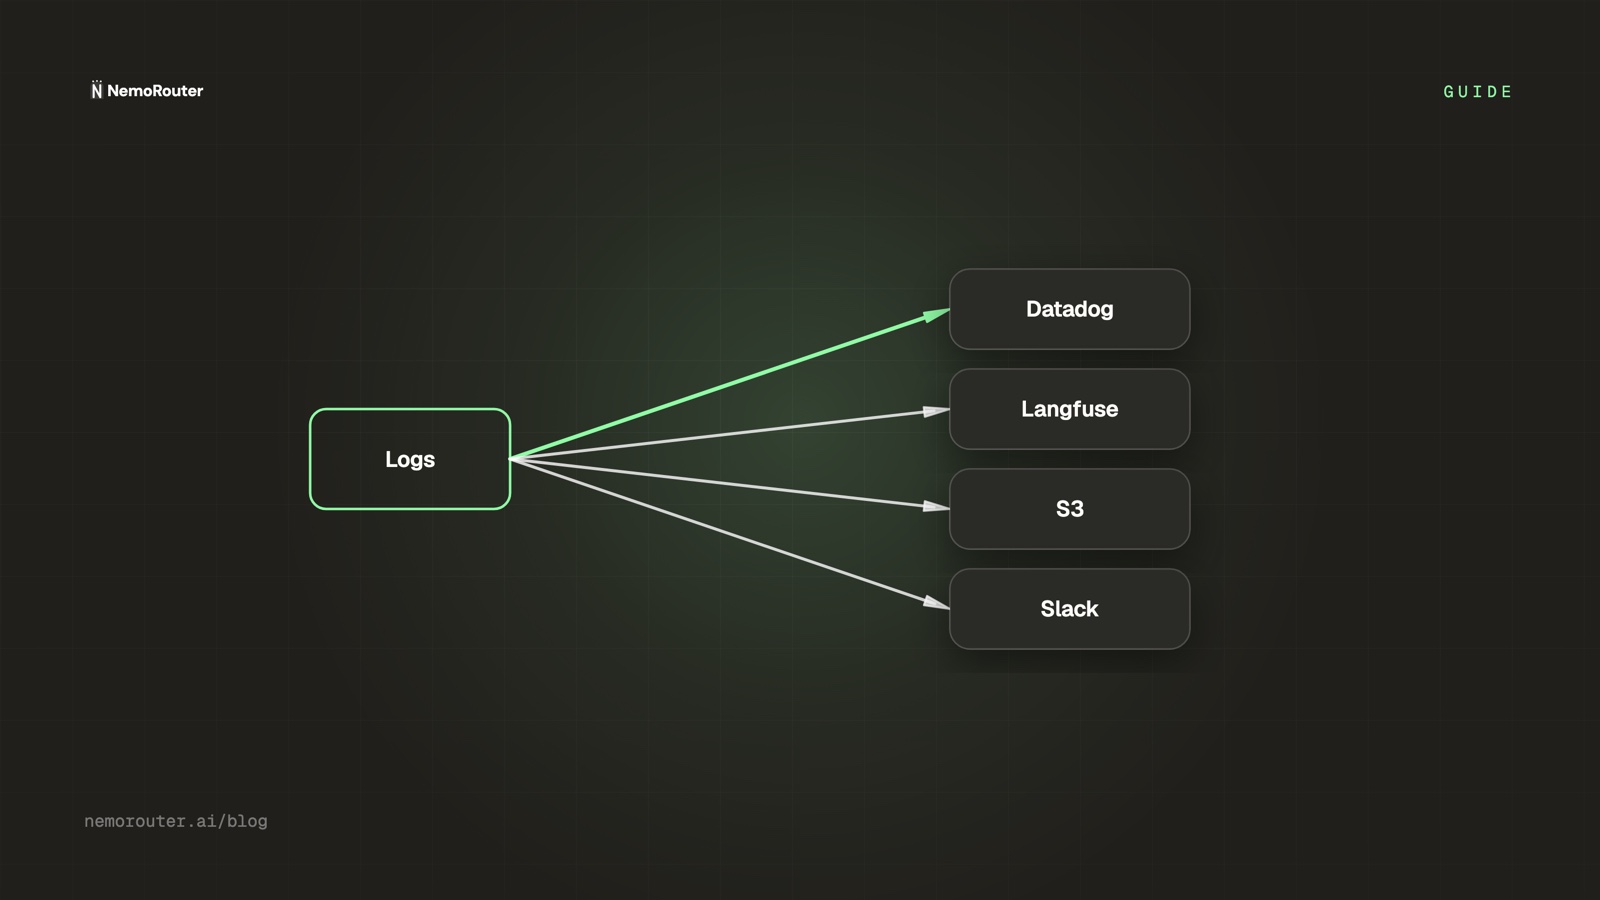
Figure 1: Gateway log fan-out pipeline forwarding execution traces to Datadog, Langfuse, cloud storage, and alerting channels.
When you need this
Your incident review has a hole shaped like AI. Latency and error rate for every other service are on one dashboard, and the model calls are somewhere else. You want p95 for a model call next to p95 for the API that wraps it, on the same screen, with the same alerting.
Prompt analytics and cost analytics disagree. The prompt tooling knows which template ran and the billing view knows what it cost, and nothing joins them. The join key exists — it is the request id — but only if you carry it into both systems deliberately.
Compliance asked for an archive. Someone needs "all AI requests for the quarter" in durable object storage with a retention policy, and the answer cannot be a screenshot. Object storage is the destination for that; the question is what goes into it, which Step 5 covers.
What you need first
- Owner or admin permission. Creating or editing callbacks and alert channels is an admin/owner action; members can view the configuration but not change it. The boundary is documented in Observability & Logs.
- Credentials for each destination you plan to add. Langfuse needs its public key, secret key and host; Datadog needs an API key; S3 and Google Cloud Storage need bucket credentials; Slack needs an incoming webhook URL. These are observability vendor credentials — you never paste a model-provider API key anywhere in nRouter, because nRouter holds the provider credentials itself (why we don't do BYOK).
- Traffic to look at. Every request through the gateway is logged automatically — no SDK change, header, or flag — so if you have made calls, the Logs page already has them.
- A decision about content. Request and response content is never written to the log, which is a privacy-safe default. Read Step 5 before you assume a destination will contain prompt text.
- A virtual key for the tagging in Step 3, created on the Keys page.
Step 1 — Decide what each destination is actually for
Adding all eight destinations because they are listed is how you end up paying three vendors to store the same rows. Pick per question.
| Destination | The question it answers | Typical fire-on |
|---|---|---|
| Datadog | Is the AI path healthy right now, next to everything else? | Both |
| Langfuse | Which prompt version produced this, and was it good? | Both |
| Amazon S3 / Google Cloud Storage | What happened last quarter, durably and cheaply? | Both |
| Slack | Did something happen a human must see immediately? | Failure only |
| Athina | Is quality regressing across releases? | Both |
| OpenMeter | How much did each customer consume, for metering? | Success only |
| Custom Callback | Anything the list above does not cover — your own HTTP endpoint | Your call |
Reading each vendor's own data model before you pick is worth ten minutes. Langfuse structures
everything as observations nested inside traces grouped into sessions, with user_id,
session_id, tags and metadata carried at trace level
(concepts) — a shape built for "which step of
which conversation went wrong". Datadog's Log Management is the opposite shape: a high-volume intake
you query and alert on, submitted through its
Logs API. The same rows are worth different amounts
in each, which is the real reason not to send everything everywhere.
The fire-on column is the setting people skip and then regret. A Slack channel wired to both becomes a firehose nobody reads within a day; wired to failure only it stays a signal. An archive wired to failure only is an archive missing the successful traffic that makes the failures interpretable.
Step 2 — Add the destination and run Test connection
Go to Log Settings → Callbacks, choose the destination type, and fill in its credentials. Sensitive fields are masked in the UI with a show/hide toggle, so a shoulder-surfer at a standup does not walk away with your Datadog key.
Then click Test connection. This is the part that works today and the part worth doing carefully: it verifies the credentials against the destination, which means a typo in a host or a rotated key fails now, at your desk, rather than silently during the first incident after streaming enables.
Beta — configure now, delivery comes later
You can add destinations and verify their credentials with Test connection today. Automatic streaming of your request logs to these services is not yet active. Configure them so they are correct and tested, and use the live paths in Step 4 for anything you need answered this week. Do not build a runbook that assumes traces are already arriving in Langfuse or metrics in Datadog.
Set the fire-on mode per destination while you are there, and — where the destination supports it — point it at a dedicated index, bucket prefix, or channel rather than a shared one. Separating at the destination is much cheaper than separating after the fact, and the vendors build for exactly this: a Datadog log index exists to "segment data into value groups for differing retention, quotas, usage monitoring, and billing" (indexes). Put AI traffic in its own index on day one and you can set its retention and its budget without renegotiating everyone else's.
Step 3 — Tag requests now so the traces are worth having later
Telemetry with no dimensions is a number you cannot act on. Attach tags at call time and every downstream system — the built-in reports today, the external destinations when they light up — can group by them.
export NROUTER_API_KEY="sk-nrouter-your-key-here"

curl -sS -D - -o /dev/null https://api.nrouter.ai/v1/chat/completions \
  -H "Authorization: Bearer $NROUTER_API_KEY" \
  -H "Content-Type: application/json" \
  -d '{
    "model": "gpt-5.4-mini",
    "messages": [{"role": "user", "content": "Summarize this support thread in two lines."}],
    "user": "customer_8842",
    "metadata": {
      "tags": ["team:support", "feature:thread-summary", "env:prod"]
    }
  }' | grep -iE '^x-nr-(request-id|request-cost|latency-ms)'
If you are also emitting OpenTelemetry from your own services, name the dimensions to match rather
than inventing a parallel vocabulary. OpenTelemetry's registry defines a gen_ai.* attribute
namespace — gen_ai.agent.id, gen_ai.conversation.id, and the request/usage attributes alongside
them (GenAI attributes);
the conventions themselves now live in the dedicated
GenAI semantic conventions repository,
which is where to check what is stable before you standardise on a name. A tag that already matches
a convention costs nothing extra today and saves a migration when a destination starts parsing it.
Two dimensions matter most. The user field populates the API Consumers report, which
attributes spend to an end user. An agent:<id> tag populates the Agents report. Both are
sensitive dimensions and require elevated permission to view. Keep cardinality sane: tag the
groupings you will report on, never a unique id per request.
Tags describe spend; they never authorize it. Which team's budget a call draws from comes from the authenticated key, not from anything in the body — that separation is the point of attributing spend by team, customer, and feature, and the per-key scoping half is virtual keys vs the master key.
Step 4 — Use the paths that deliver today
Three of them, and between them they cover most of what people wanted the callbacks for.
The Logs page and its CSV export. /logs lists every request with model and provider, token
counts and total cost, latency and status, cache-hit status, start and end timestamps, and a request
id. Search by request id to jump to a call, filter by model, status and time range, then export the
current view to CSV. That export is a perfectly good input to a warehouse job while streaming is in
Beta.
The Advanced reports. /advanced/cost, /advanced/usage, /advanced/cost-vs-usage,
/advanced/keys, /advanced/agents and /advanced/api-consumers each carry the same filter bar —
time window, group-by (model, provider, key, team, or tag) and further filters — with CSV export on
most of them for admins and owners. If the question is "which model got quietly expensive", that is
cost vs usage, and it is live now.
Alert channels, including a generic webhook. Create channels under Observability → Alerts →
Channels (Email, Slack, Microsoft Teams, Jira, or a webhook), then enable alerts on /alerts and
bind them. Budget threshold crossings dispatch a JSON envelope to a webhook with title, message,
severity and a details object; when you configure a secret, the payload is signed with
HMAC-SHA256 and carries the signature header:
import crypto from "node:crypto";

// Verify an nRouter webhook before trusting it.
export function verifyNrouterSignature(rawBody: string, header: string, secret: string): boolean {
  if (!header?.startsWith("sha256=")) return false;
  const expected = crypto.createHmac("sha256", secret).update(rawBody).digest("hex");
  const provided = header.slice("sha256=".length);
  return crypto.timingSafeEqual(
    Buffer.from(expected, "hex"),
    Buffer.from(provided, "hex"),
  );
}
Verify before you trust: without a secret, anyone who learns the URL can replay a payload at you.
The full envelope, the canonical-JSON serialization used for signing, and a Python verifier are in
the webhooks documentation. PagerDuty is reachable through a generic webhook
pointed at its Events API.
Step 5 — Decide what must never leave
A forwarding destination is another place your data lives, under someone else's retention policy. Decide the boundary before you turn one on rather than after a customer asks. Datadog states the mechanism plainly — "indexed logs are deleted from the Datadog platform once their retention period, as defined by you, expires" (Log Management data security) — which means the clock on a forwarded row is one you set over there, not one that follows it from here.
That clock is a legal object as well as an operational one. GDPR Article 5 requires personal data to be "adequate, relevant and limited to what is necessary" and "kept in a form which permits identification of data subjects for no longer than is necessary" (Art. 5 GDPR). Prompt text is routinely personal data, so a destination configured to receive it inherits both duties.
The current defaults are conservative and worth knowing precisely. Request and response content is never written to the log — the logging level governs how much request metadata is retained, and full logging that captures request and response content is a future capability, not a current one. Logs apply PII masking in the browser for email, phone and card patterns, and server-side when org-level redaction is enabled. Logs are retained 90 days today; configurable log retention and PII redaction under Localization are marked coming soon and are not yet enforced, so do not design a compliance control around them.
Cost headers always pass through regardless of your logging level, so reducing what you log never degrades billing accuracy. That is a deliberate split: privacy posture and spend accuracy are independent knobs. The judgement calls about what belongs in a log at all are in what to log (and not log) on an LLM gateway, and the technique for keeping logs debuggable after redaction is in redacting PII from LLM logs.
Verifying it worked
Test connection returns green. That is the one signal available for a callback destination today, and it is a real one: it proves the credentials, host and permissions are correct. Re-run it after any credential rotation on the vendor side.
A bound alert actually arrives. This is the end-to-end proof that a destination path works.
Create a throwaway budget with a low Max Spend, a soft threshold at 50%, and your Slack or
webhook channel bound to it, then send enough traffic to cross the threshold. The notification
should land with [nRouter] in the title and a details object carrying identifiers. Delete the
budget afterward.
The CSV has the columns you expected. Export a filtered view from /logs and confirm it carries
model, tokens, cost, latency, status and request id. If a downstream job is going to depend on those
columns, the time to find out is now.
Request ids correlate across systems. Every response carries x-nr-request-id, and it is the
join key between your application logs, the gateway log row, and anything you forward later. Log it
on your side today and the correlation works retroactively the moment streaming enables. It is also
what support asks for first.
Alerts never blocked anything. Confirm your traffic was unaffected while the alert fired. Alerts are notification-only by design; the hard stop lives in budget controls, never in the observability path.
What goes wrong
Expecting traces in Langfuse today. Symptom: Test connection passes and nothing arrives. That is the documented Beta state, not a misconfiguration. Fix: use the CSV export and the Advanced reports for now, and keep the destination configured so it is correct on day one.
An alert with no channel bound. Symptom: an alert is enabled and nobody is notified. A telemetry alert evaluates whether or not a channel is bound — with none bound it simply has nowhere to deliver. Fix: create the channel under Observability → Alerts → Channels first, then bind it.
Slack wired to fire on both. Symptom: the channel is muted within a day, which means the one real incident is muted too. Fix: failure-only for chat destinations; both for archives and metrics.
A member trying to add a destination. Symptom: the configuration is visible but not editable. Callbacks and channels are admin/owner actions by design. Fix: ask an admin, or change the role deliberately.
Relying on a "coming soon" control for compliance. Symptom: an audit answer that cites configurable log retention or the Localization PII toggle. Those are not enforced yet. Fix: base the answer on what is true today — content is not stored, masking applies as described, retention is 90 days — which is also the honest framing in the SOC 2 checklist for LLM gateways.
Expecting the daily digest in Slack. Symptom: Daily Reports enabled, nothing in the channel. The digest is emailed to owners and admins and cannot be routed to a channel. Fix: use a bound budget threshold or a telemetry alert for channel delivery.
Try it
Observability, guardrails, evals, A/B tests, prompt management and per-team budgets are on every
plan — plans change the monthly allowance and the guaranteed throughput, never the feature set. Pay as
you go is $0 subscription with a 4% platform fee added on top of each credit purchase — a flat 4% of
the credits, so $100 of credits costs $104.00 — and every plan pays that same 4%; subscriptions from
$20/mo add a monthly nrouter/auto allowance and higher rate limits, not a lower fee. The
table is at /pricing.
Load the $5 minimum — the platform fee rides on top — make a
handful of tagged calls, and open /logs. You will have a request-by-request view with cost and
latency before you have configured anything at all; the destinations are the layer you add on top.
→ Start at app.nrouter.ai/signup, then open Log Settings → Callbacks and Alerts.
Want a destination that is not on the list? Say so in the nRouter community — the Custom Callback covers your own endpoint in the meantime.
See also
- What to Log (and Not Log) on an LLM Gateway — the policy decision that should precede any forwarding configuration.
- Write-Time PII Redaction in LLM Logs, Without Losing Debug Detail — how to keep a redacted log useful during an incident.
- Attribute LLM Spend by Team, Customer, and Feature — the tags from Step 3, and how far they should and should not be trusted.
- LLM Latency: p50, p95, p99, and Time-to-First-Token — which latency number to alert on once the metrics land in your dashboard.
- Cost vs Usage: Finding the Quietly Expensive Model — the report that answers the "why did the bill move" question today.
- A SOC 2 Checklist for LLM Gateways — how log retention and redaction fit an audit, stated as what is true now.
- Pricing — plan table and platform fee; observability is not a paid add-on.
Sources
Verified 2026-08-23. Corrections to hello@nrouter.ai.
-
Callback destinations, fire-on modes, Test connection and the Beta status: Observability & Logs
-
Alert catalog, channels and delivery: Alerts & Notifications
-
Webhook envelope and HMAC-SHA256 signature verification: Webhooks
-
Reports, group-by dimensions and CSV export: Analytics & Reports
-
Logging level, PII masking and retention controls: Organization Settings Destination vendors, cited for their own behaviour
-
Datadog log intake: Logs API · per-index retention, quotas and billing: Indexes · retention and deletion of indexed logs: Log Management data security
-
Langfuse's observation / trace / session model and trace-level
user_id,session_id,tags: Concepts · docs -
Amazon S3 documentation: docs.aws.amazon.com/s3
-
Slack incoming webhooks: api.slack.com/messaging/webhooks
Standards
gen_ai.*attribute names, and where the conventions are now maintained: OpenTelemetry GenAI attributes · semantic-conventions-genai- Data minimisation and storage limitation: Art. 5 GDPR