The short answer: a useful LLM request log carries identity (request id, key, organization), shape (model, provider, prompt and completion tokens), outcome (status, latency, cache hit), and money (settled cost). Those fields answer nearly every operational question. Prompt and completion content is a different class of data with a different risk profile — on nRouter it is not stored today, which is the privacy-safe default.
The short answer
Request logs are the first thing you reach for when something breaks and the last thing you want leaked. They are simultaneously your best debugging tool and a concentrated store of exactly the data you told customers you would protect.
The resolution is not a philosophical position, it is a field list. Split the log into metadata (identity, shape, outcome, money) and content (the prompt and the completion).
Metadata carries almost all of the operational value and almost none of the risk. Content carries a narrow slice of extra value — reproducing one specific bug or sampling for quality review — and nearly all of the risk.
Log the first generously. Treat the second as a deliberate, bounded decision you revisit, not a default you inherit.
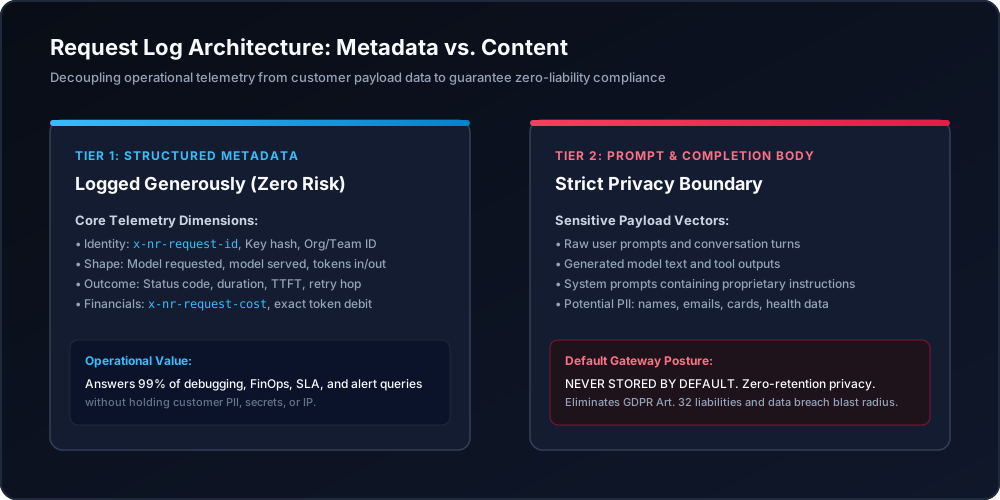
Figure 1: Request log architectural separation decoupling rich operational telemetry from zero-retention payload content.
When you need this
A customer reports a bad answer and you cannot find the call. Without a request id surfaced to your application and echoed in your own logs, you are searching by timestamp and hoping. This is the single most common gap.
Your spend chart and your invoice disagree and you do not know which to believe. Budget enforcement reads the credit ledger, which is authoritative; the analytics charts are drawn from observability logs. Small differences are expected. Knowing which store answers which question stops that from becoming an investigation.
Legal asked what you retain, and nobody had a straight answer. "We log everything, probably forever" is a sentence that reads as harmless right up until it appears in a breach disclosure or a data-subject request. A written field list and a stated retention window is the artefact that conversation needs.
What you need first
-
An organization with traffic. Every request through nRouter is logged automatically — there is no SDK change, header, or flag to switch on.
-
Owner or admin role if you intend to change the logging level. Members see the Data Policy controls as read-only; that is a documented permission boundary, not a temporary limitation. Roles: Team Management.
-
A virtual key, so log rows attribute to something narrower than "the organization" — created on
/[organization]/keys, per API Key Management. -
NROUTER_API_KEYexported and the base URLhttps://api.nrouter.ai/v1for the verification steps below.
Step 1 — Know the fields a request log has to carry
The Logs page (/[organization]/logs) is the request-by-request view. Each
row carries:
| Field group | Fields | What it answers |
|---|---|---|
| Identity | Request ID, key, organization | Which call was this, and whose? |
| Shape | Model, provider, prompt / completion / total tokens | What did we ask for, and how big was it? |
| Outcome | Status (success / error), latency, cache-hit status | Did it work, how fast, and did we pay for it twice? |
| Money | Total cost in USD | What did this specific call cost? |
| Time | Start and end timestamps | When, and for how long? |
That list is close to what the industry has converged on independently.
OpenTelemetry's GenAI span convention makes gen_ai.operation.name and
gen_ai.provider.name required.
The specification also recommends gen_ai.request.model, gen_ai.response.model,
gen_ai.response.finish_reasons, gen_ai.response.id, and the
gen_ai.usage.input_tokens / gen_ai.usage.output_tokens pair
(GenAI spans).
Identity, shape, outcome — and not one byte of the prompt.
That is the operational core, and stating it as a list clarifies its utility: nearly every operational question is answerable from it alone. Cost by model, latency percentiles, error-rate regressions, cache effectiveness, and per-key spend never need a single character of prompt text.
The percentile question in particular is worth understanding before you draw conclusions from an average: LLM Latency: p50, p95, p99, and Time-to-First-Token.
Every response also carries the id of the call back to your application, so your logs and the gateway's can be joined on it without a lookup table:
| Header | Use |
|---|---|
x-nr-request-id | Always present. Quote it in a support ticket; store it beside your own trace id |
x-nr-request-cost | Settled cost in USD — absent when a call could not be priced |
x-nr-cost-status | exact or unpriced — the companion that tells you which case an absent cost is |
x-nr-model | The model that actually served the request, which is not always the one you asked for |
x-nr-input-tokens, x-nr-output-tokens, x-nr-total-tokens | Token counts for this call |
The response does not name your organization, team, or key: tenancy is resolved
from the authenticated virtual key and is never echoed back. Join on
x-nr-request-id instead — the matching row in the request log carries the
authenticated organization, team, user, and key for that call.
Latency is not a header either. Time the call on your own clock and store the elapsed value beside the request id, or read percentiles directly off the dashboard.
Absent is not zero
x-nr-request-cost is omitted when a call cannot be priced. Client code that
defaults a missing header to 0.0 will silently under-report spend in your own
dashboards while the ledger stays correct. Treat absent as unknown and
reconcile against the ledger.
Step 2 — Set the logging level, and know what it governs
The logging level is set under Data Policy (Manage → Logging) and has four values: zero, metadata, full, and PII-redacted. Changing it is an owner or admin action.
What it governs is worth being precise about, because it is easy to assume more than is true. Request and response content is never written to the log — that is the privacy-safe default. The logging level currently controls how much request metadata is retained rather than whether prompts are warehoused.
One mechanism sits outside the log and is worth naming here: a response body may be held for a few minutes in a short-lived serving cache, keyed to your organisation and team, so a byte-identical repeat request skips the provider call. It is a cache and not a record — not queryable, not exported, and expired long before any retention window matters.
Full-content logging, for teams that need complete reproduction and accept the trade, is on the roadmap and not a capability to plan against yet. A separate PII redaction control exists under Localization and is likewise not yet enforced.
Two consequences that matter operationally:
- Reducing the logging level never affects billing.
x-nr-request-costpasses through regardless, so spend, budgets and analytics stay accurate at every level. Privacy and money are decoupled by design — the argument for that is in Cost honesty. - Retention is bounded, not indefinite. Request logs are currently retained for 90 days. Financial records are a separate class kept per obligation — those are ledger entries, not prompt content, and they are what How to read your LLM credit ledger describes.
The same convention is explicit that content is the exception rather than the baseline. The message attributes that would carry prompt and completion text are opt-in, flagged because the value "is likely to contain sensitive information including user/PII data", with instrumentations permitted to "filter or truncate" them.
A log that omits content by default is following the standard, not falling short of it.
Retention is the other half, and it is a policy you are expected to write down rather than inherit.
NIST's Guide to Computer Security Log Management (SP 800-92) treats log retention as an explicit organisational decision balancing investigative need against storage and exposure. It remains the clearest statement that "how long do we keep this" is a governance question with an owner, not a storage default.
The general principle, whoever you run logging with: keep aggregates long, keep raw rows short, and keep content shortest of all.
The moment content storage does become available, the right default for most teams is still redacted or off — the reasoning is laid out in Write-Time PII Redaction in LLM Logs, Without Losing Debug Detail.
Step 3 — Correlate a failure by request ID
This is the workflow the whole log exists for, and it takes four steps.
- Capture
x-nr-request-idin your application on every call, success or failure, and store it beside your own request id.
import os
from openai import OpenAI

client = OpenAI(
    api_key=os.environ["NROUTER_API_KEY"],
    base_url="https://api.nrouter.ai/v1",
)

resp = client.chat.completions.with_raw_response.create(
    model="gpt-5.4-mini",
    messages=[{"role": "user", "content": "hello"}],
    user="tenant_acme",
)
print(resp.headers.get("x-nr-request-id"))
print(resp.headers.get("x-nr-request-cost")) # may be absent — do not default to 0-
Search that id on
/[organization]/logs. The search box takes a request id directly and jumps to the row. Filter by model, status and time range first if you are exploring rather than looking up. -
Click into the row for the full detail view, then check whether a guardrail was involved — the Guardrails → Logs view records every evaluation with its mode, action and latency, correlated on the same request id. A
400carryingguardrail_blockedcosts zero credits and never reached the provider; see Guardrails. -
Export the filtered view to CSV if you need to hand it to someone, and keep the export scoped — a filtered export is a smaller liability than a table dump.
For administrative actions rather than model calls — who changed a budget, who
rotated a key — the request log is the wrong store. That is the audit trail at
/[organization]/audit, a separate and lower-volume concern described in
Building a tamper-evident audit trail.
Step 4 — Fan out to the tools you already run
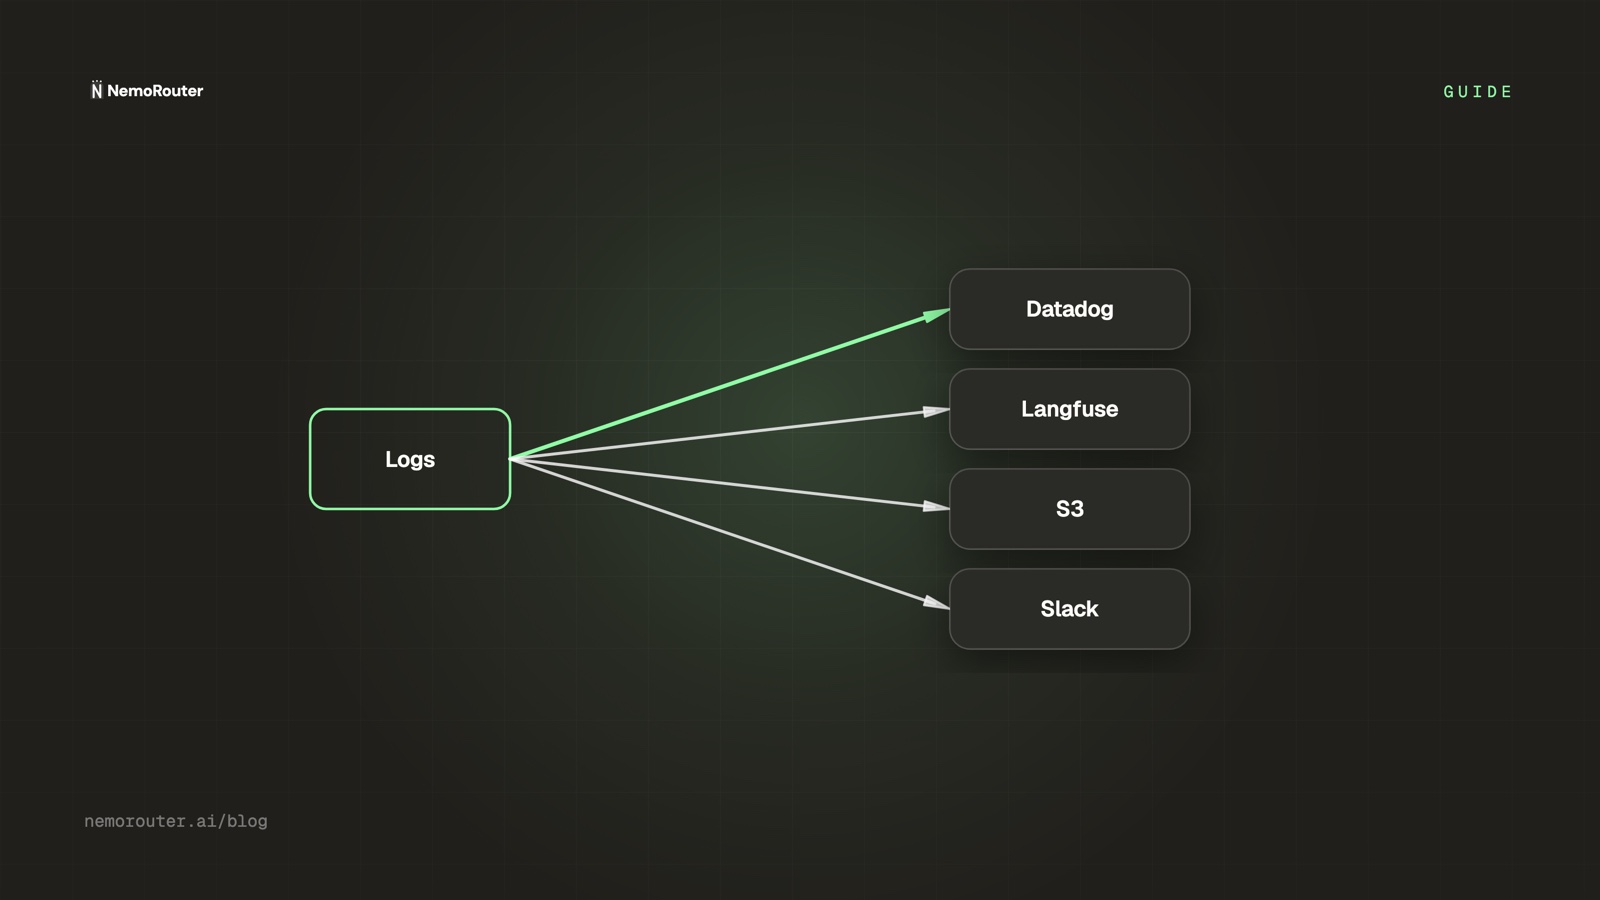
Under Log Settings → Callbacks you can configure external destinations — Langfuse, Datadog, Amazon S3, Google Cloud Storage, Slack, Athina, OpenMeter, or your own HTTP endpoint via a Custom Callback. Each destination has its own credentials, entered once and masked in the UI with a show/hide toggle, and each can be set to fire on success only, failure only, or both.
This capability is in Beta: you can add destinations and verify them with Test connection today, and automatic streaming of request logs to those services is not yet active. Plan the topology now; do not assume delivery yet.
When it does carry your logs, the design question is the one people usually get to a quarter late: a callback can forward content, not just metadata, and a third-party destination is another place that data lives. Redaction has to apply before the fan-out, never after — redacting on display while the raw value is already at rest in a downstream store is theatre.
GDPR Article 32 names "pseudonymisation and encryption of personal data" as a measure appropriate to the risk of processing (Art. 32 GDPR). A measure applied after the data has already been copied to a third party is not a measure at all.
If the destination is an archive rather than a dashboard, the mirror-image concern applies: the rows must survive a bad actor and a bad script.
Object stores support this directly. S3 Object Lock stores objects "using a write-once-read-many (WORM) model" and can prevent deletion "for a fixed amount of time or indefinitely" (S3 Object Lock). Decide both retention and immutability before the first object lands, not after an auditor asks.
Destination-by-destination setup is in Set Up LLM Log Callbacks: Datadog, Langfuse, S3, Slack.
Alert channels are a different mechanism and worth not confusing with callbacks: a callback is a destination for logs, while a channel (Email, Slack, Microsoft Teams, Jira, or a generic webhook) is where a notification goes when an alert fires.
You bind a channel to a budget's thresholds on the Budget Controls page — see Alerts & Notifications.
Managed request logs vs a self-hosted trace store
Teams arriving from a self-hosted tracing stack — Langfuse on your own infrastructure, an OpenTelemetry collector into ClickHouse, a homegrown table — are usually weighing two genuinely different trade-offs, not one better product.
| Gateway request logs | Self-hosted trace store | |
|---|---|---|
| Instrumentation | None — every call is logged because it traversed the gateway | An SDK or collector in every service, kept in step with every framework upgrade |
| Coverage | Whatever goes through the gateway, including calls from tools you did not write | Whatever you remembered to instrument |
| Cost figure | The settled cost, recorded on the request path | Reconstructed from token counts and a price table you maintain |
| Data residency | The data sits with the provider of the gateway | The data sits with you — which is the point, and the work |
| Retention control | The window the platform offers (90 days today) | Whatever your storage budget allows |
| Operations | None | Storage, backups, upgrades, access control, on-call |
| Enforcement | Budgets, rate limits and guardrails act on the same request | Observation only — a trace store cannot block a call |
None of that column is hypothetical. Langfuse publishes its self-hosting guide as a set of Docker deployment scenarios with configuration, security, administration and upgrade sections of its own, and notes that "some add-on features require a license key" (self-hosting). That is a fair description of the trade: real control, real operational surface.
The honest summary: a self-hosted trace store gives you total control over the data and unlimited retention, and charges you the operational cost of a database plus the instrumentation cost in every service.
Gateway logs give you complete coverage with zero instrumentation and a cost figure that came from the request path rather than a reconstruction, and ask you to accept a platform retention window.
The decisive difference is usually not observability at all. A trace store watches; a gateway acts.
The same request that produced the log row was also checked against a budget, a rate limit, and a guardrail before it left — described in Credits, budgets, rate limits, guardrails. If you want both the traces and the enforcement, the callbacks above are the bridge rather than a replacement.
The full side-by-side against one popular self-hosted option is Langfuse alternative, and the broader build-versus-buy case is Managed LLM Gateway vs Self-Hosted: Why We Carry the Pager.
Verifying it worked
- Send one call and read the headers back, confirming
x-nr-request-idis present:
curl -sS -D - -o /dev/null https://api.nrouter.ai/v1/chat/completions \
  -H "Authorization: Bearer $NROUTER_API_KEY" \
  -H "Content-Type: application/json" \
  -d '{"model":"gpt-5.4-mini","messages":[{"role":"user","content":"log smoke test"}]}' \
| grep -i '^x-nr-'-
Paste that request id into the search box on
/[organization]/logsand confirm exactly one row comes back, with the model, tokens, latency, status and cost you expect. -
Force an error and find it. Send a request with a model name that does not exist, then filter the Logs page by status to confirm the failure is recorded as well as the success. A log that only captures the happy path is not a log.
-
Check the cost reconciles. Compare the row's cost against
/[organization]/advanced/costfor the same window. Small differences between charts and the ledger are expected; a large one is a question worth asking. -
Confirm the permission boundary. Sign in as a member and confirm the Data Policy controls render read-only. If a non-admin can change your logging level, your retention policy is advisory.
What goes wrong
You never captured the request id. Everything else in this guide degrades to searching by timestamp. Capture it at the client wrapper, on both the success and the exception path, before you need it.
You treated an absent cost header as a free request. Absent means unpriced, not zero. It is the single most common way a self-built spend dashboard drifts away from the ledger.
You assumed the logging level controlled billing. It does not. Cost passes through at every level, so turning logging down to protect privacy never costs you accuracy in budgets or analytics.
You confused the request log with the audit trail. They answer different questions and have different volumes and retention. "Who raised this budget" is never in the request log.
You planned around content logging that is not there yet. Request and response content never enters the log, and the short-lived serving cache is no substitute — it holds a response for minutes, is not queryable, and is gone long before an investigation starts.
If your incident runbook assumes you can pull the exact prompt six weeks later, the runbook needs a different step: capturing what you need on your own side, deliberately and with your own redaction, rather than expecting the gateway to have kept it.
Try it
Request logs, Advanced reports, guardrail logs, the audit trail, alert channels and callback destinations are available to every nRouter customer on every plan. Every plan pays the same 4% platform fee on credits, charged on top.
Plans vary only the monthly nrouter/auto allowance — subscriptions from
$20/mo — and the default rate limits, never the feature set.
Load the $5 minimum — the platform fee rides on top — send one call, and look it up by request id sixty seconds later. Start at app.nrouter.ai/signup, or fire a first request from the browser in the Playground.
If your question is about retention and residency specifically, start at Security and Trust.
See also
-
Write-Time PII Redaction in LLM Logs, Without Losing Debug Detail — the field-level version of this post's content-versus-metadata split.
-
Set Up LLM Log Callbacks: Datadog, Langfuse, S3, Slack — destination-by-destination setup for the callbacks described above.
-
Building a tamper-evident audit trail for admin actions — the other log, for deliberate administrative acts rather than model calls.
-
LLM Latency: p50, p95, p99, and Time-to-First-Token — what to compute from the latency field before drawing a conclusion from an average.
-
A SOC 2 checklist for LLM gateways — where logging level, retention and access scoping land in an audit.
-
Langfuse alternative — the detailed comparison with a self-hosted trace store, including what it genuinely does better.
-
Security — how request data is handled, for the conversation legal actually wants to have.
Sources
Verified 2026-06-15. Field lists, logging levels, retention, roles and callback destinations attributed to nRouter come from our own documentation.
The external references below are cited for the specific claim each supports. If something has drifted, email hello@nrouter.ai and we will correct it.
Standards and external references
- Required and recommended GenAI span attributes, and content capture as opt-in sensitive data: OpenTelemetry GenAI spans
- Log retention as an explicit organisational policy: NIST SP 800-92, Guide to Computer Security Log Management
- Pseudonymisation and encryption as security-of-processing measures: Art. 32 GDPR
- WORM retention for an archive destination: Amazon S3 Object Lock
- What running your own trace store involves: Langfuse self-hosting
nRouter
- Log rows, callbacks, data policy and PII masking: Observability & Logs
- Logging level, retention window and privacy controls: Settings
- Response headers and error statuses: Chat Completions API
- Report paths, group-by dimensions and ledger-vs-chart differences: Analytics & Reports
- Guardrail evaluation logs and request-id correlation: Guardrails
- Plans and the platform fee: nrouter.ai/pricing