

Engineering
Sub-15ms LLM Gateway Routing with Warm HTTP/2 Pools
How connection pooling, in-memory preflight gating, and multiplexed HTTP/2 streams eliminate cold TCP/TLS handshakes and keep routing overhead under 15ms.
nRouter team
12 minRead →Operating production LLMs without granular observability turns generative workflows into opaque black boxes. Full-stack LLM observability binds edge request parameters, prompt token counts, completion latencies, guardrail inspection scores, and exact monetary costs into a unified distributed trace. High-cardinality telemetry empowers engineering teams to detect latency regressions, diagnose provider errors, and audit regulatory compliance.
Tracing requests across multiple microservices, proxy layers, guardrail sidecars, and third-party model providers often leaves fragmented log files with no common correlation identifier, complicating root-cause debugging.
Real-time token streaming generates massive log volumes. Systems must capture precise tokenomics and timing metrics without creating disk I/O bottlenecks or slowing down inference.
Indiscriminately storing full prompt and response payloads creates severe privacy risks for GDPR and HIPAA compliance, requiring granular data retention policies.
Calculating exact dollar spend in real time requires reconciling differing input, output, cached, and multimodal token rates across dozens of foundation model providers.
Distributed trace identifier binding edge WAF logs, OTLP spans, and immutable database spend rows.
High-precision financial audit records capturing exact token counts, provider rates, and funding sources.
Asynchronous streaming callbacks to Datadog, Langfuse, Amazon S3, and generic customer webhooks.
Every inference request routed through nRouter receives an immutable x-nr-request-id generated at the edge WAF. As requests traverse Preflight Phases 1 through 4 and stream from downstream providers, nRouter records token metrics, latency milestones, and exact costs into a 22-column spend row. Configurable data policies let organizations choose between zero-logging, metadata-only, full-logging, or PII-redacted storage. Furthermore, native OpenTelemetry (OTLP) exporters stream traces and metrics directly to Datadog, Langfuse, and cloud object storage for enterprise-wide visibility.
Explore our observability guides to discover how to debug agentic loops, monitor p99 latency percentiles, and set up real-time spend anomaly alerts.
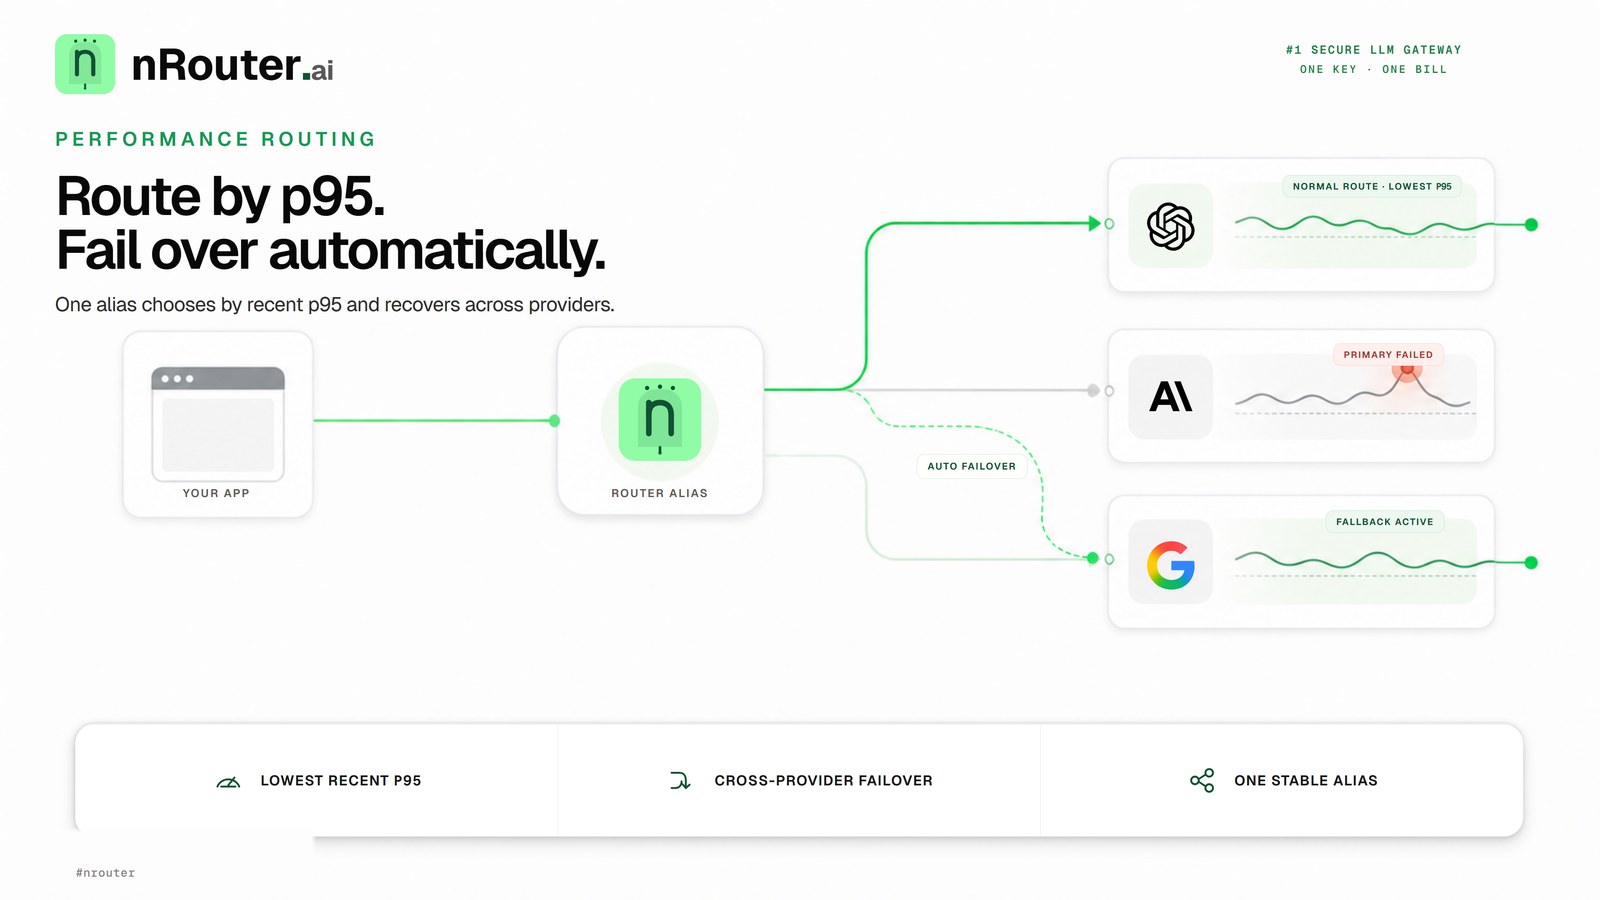
How connection pooling, in-memory preflight gating, and multiplexed HTTP/2 streams eliminate cold TCP/TLS handshakes and keep routing overhead under 15ms.
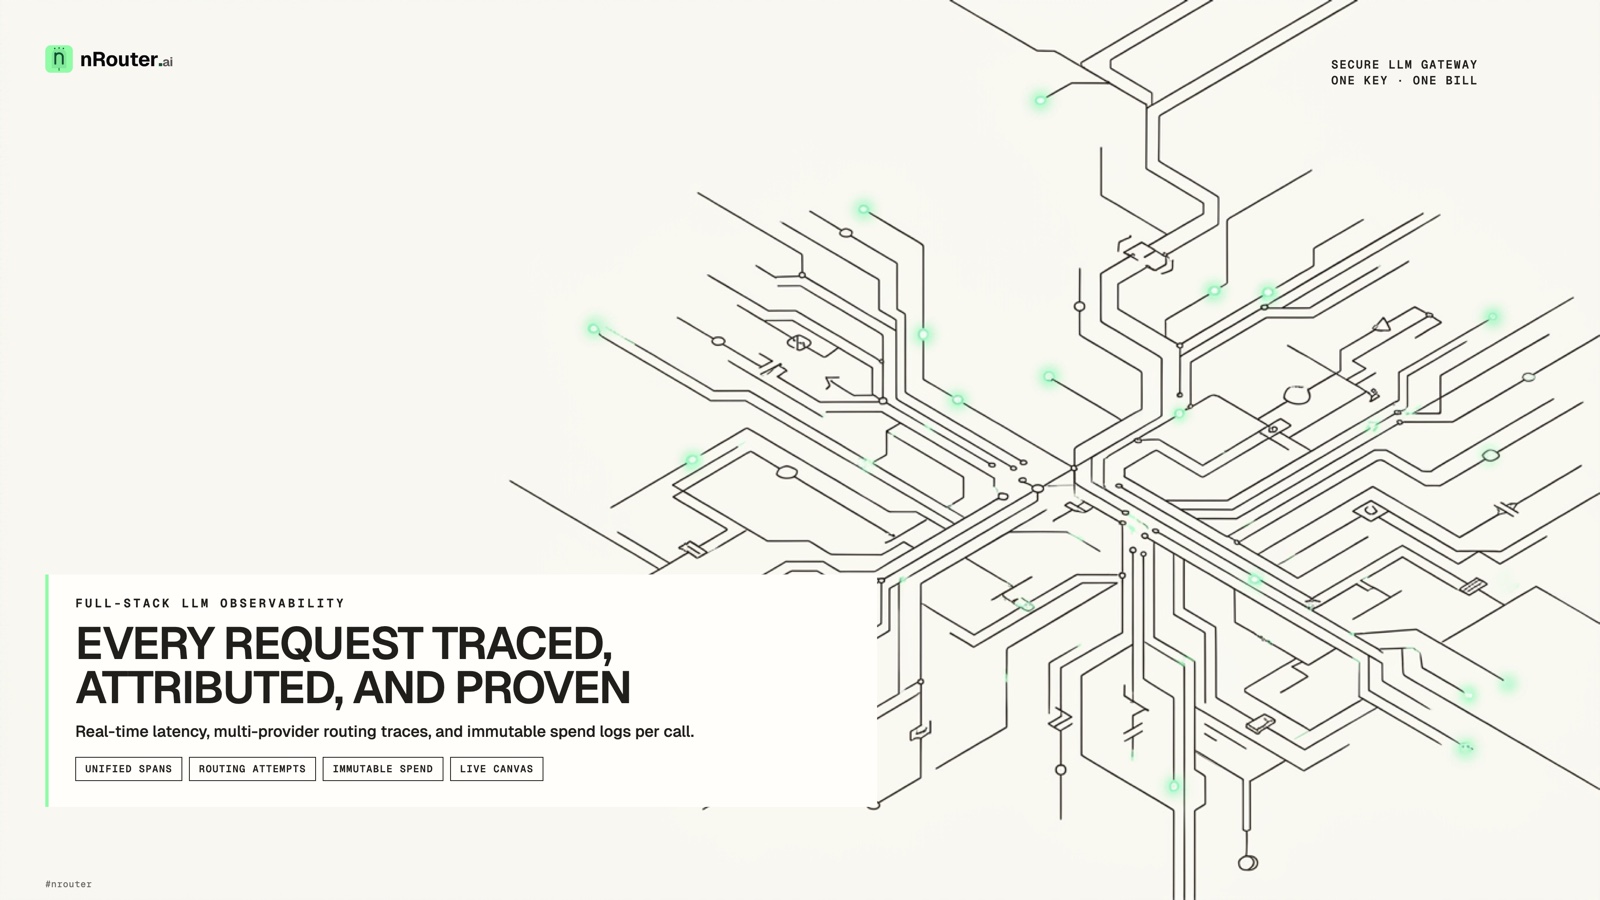
Inspect end-to-end inference traces, exact-cent spend rows, and multi-provider routing decisions in real time with unified OpenTelemetry spans and edge headers.
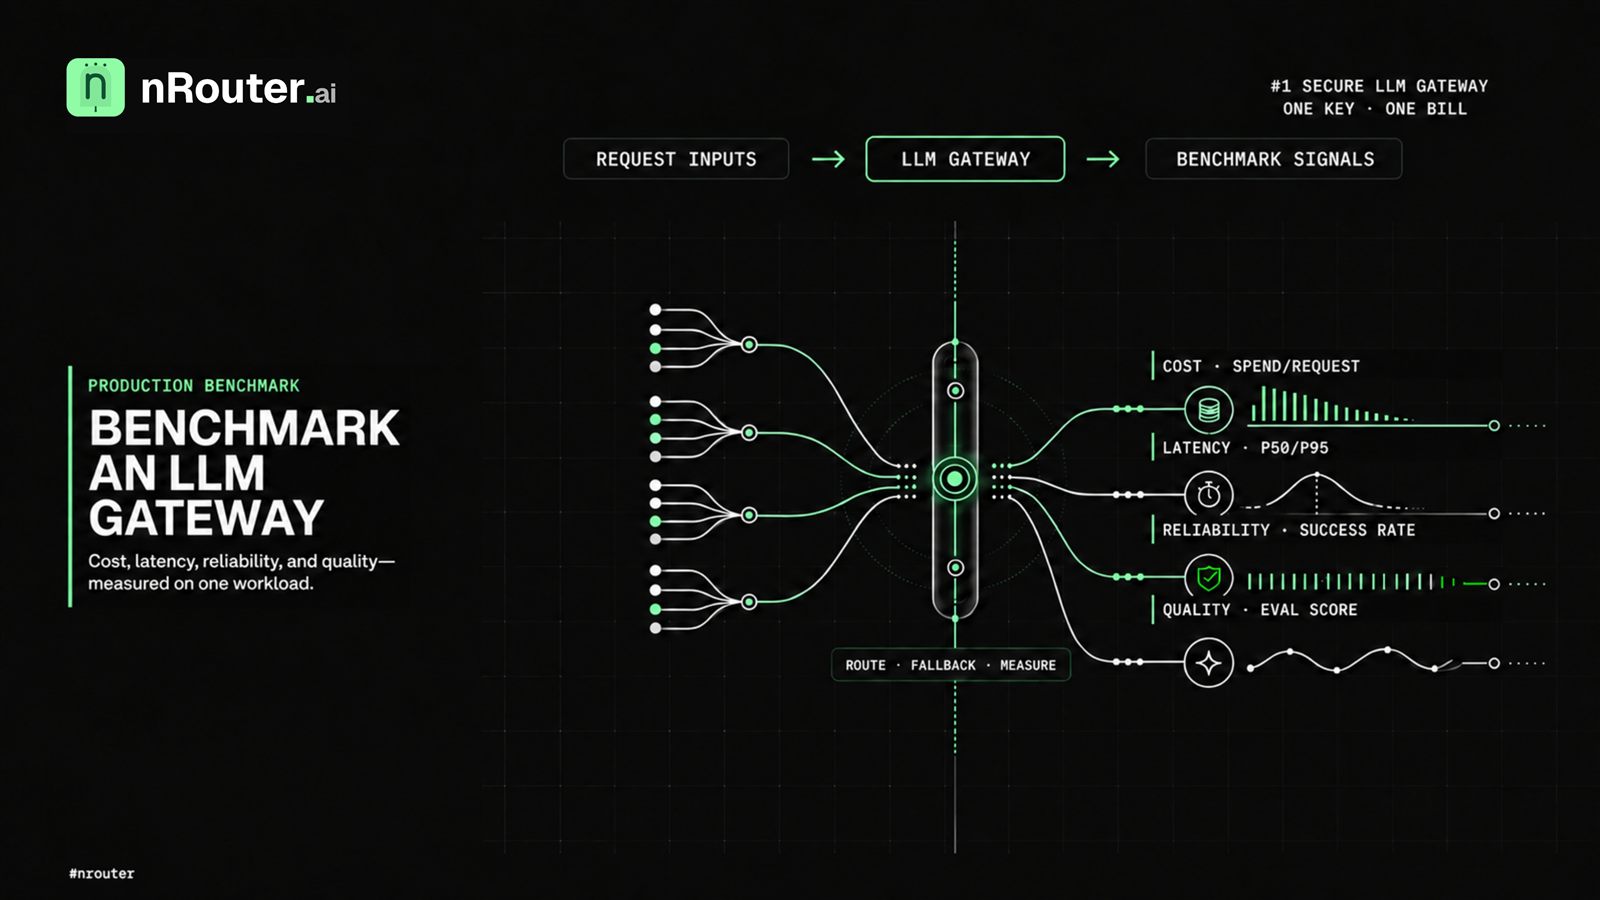
Benchmark an LLM gateway under production load with repeatable measurements for provider cost, tail latency, fallback recovery, and answer output quality.
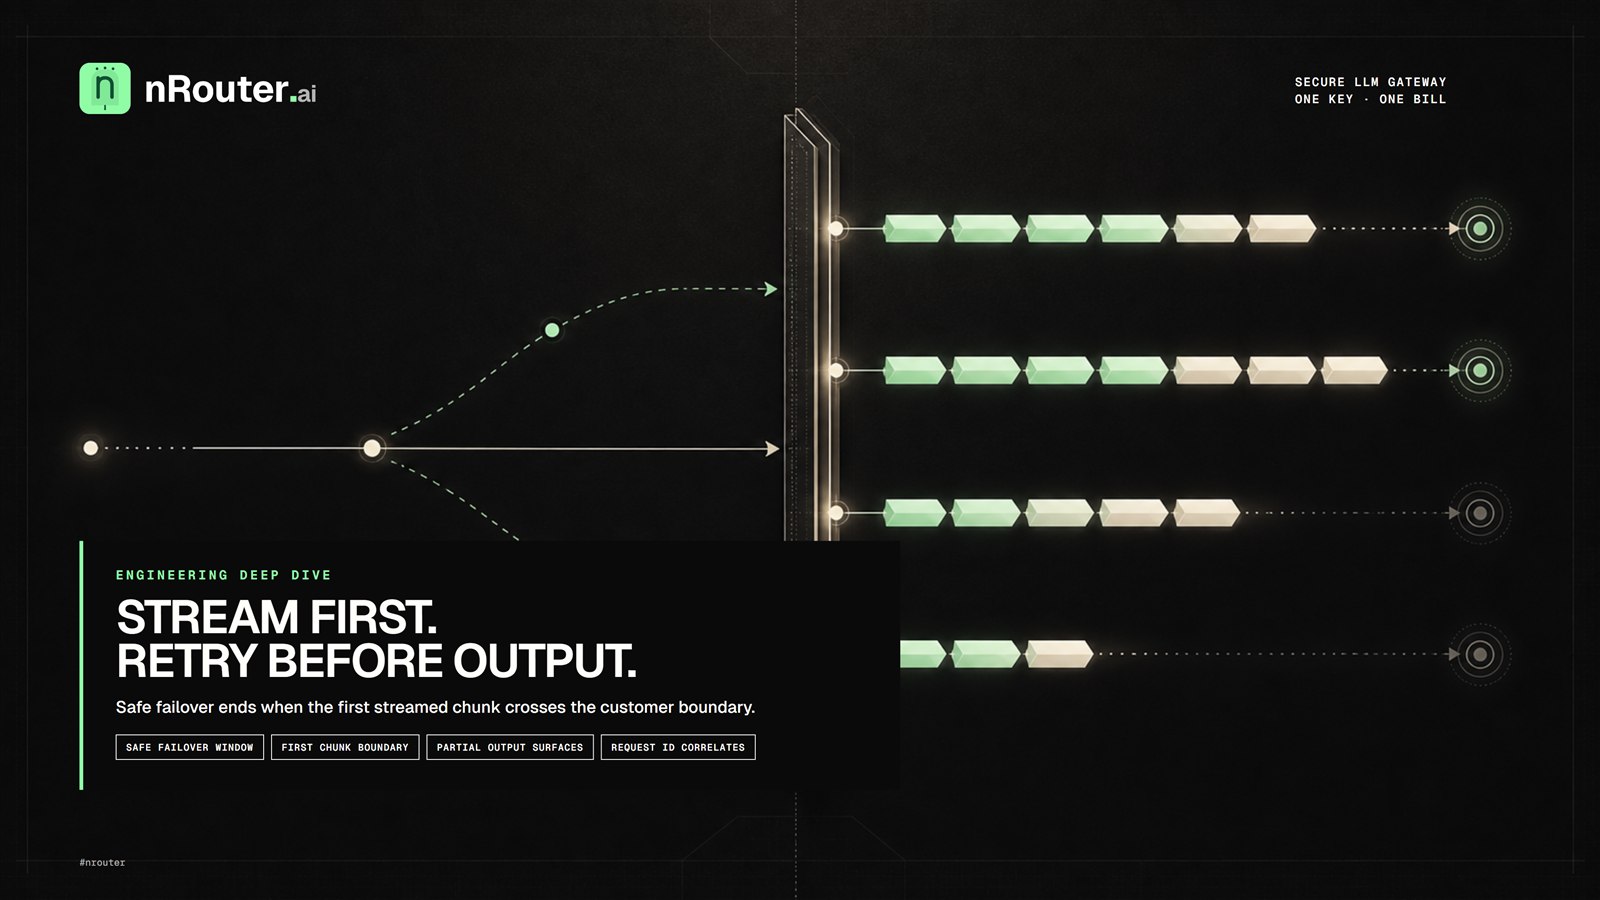
Understand where LLM streaming failover stops being safe, why partial output cannot be replayed silently, and how clients recover without duplicated text.
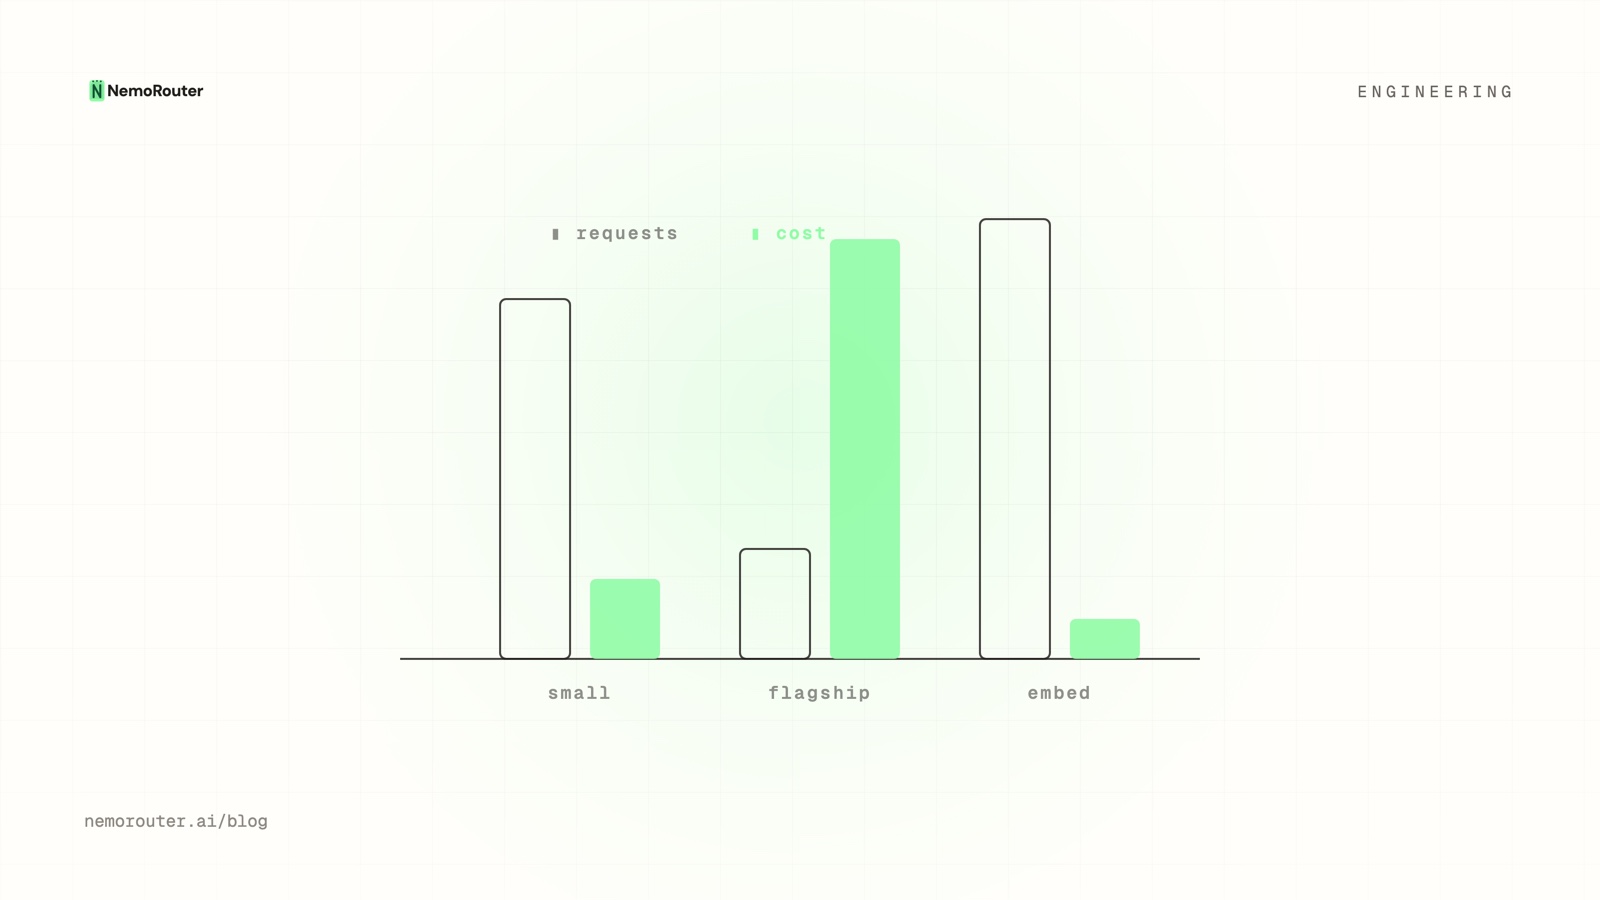
Request count and dollar cost tell different stories, and the gap between them is where the savings are. Here are the four shapes an overlay of cost and usage produces, which one to chase first, and what makes the numbers trustworthy enough to act on.
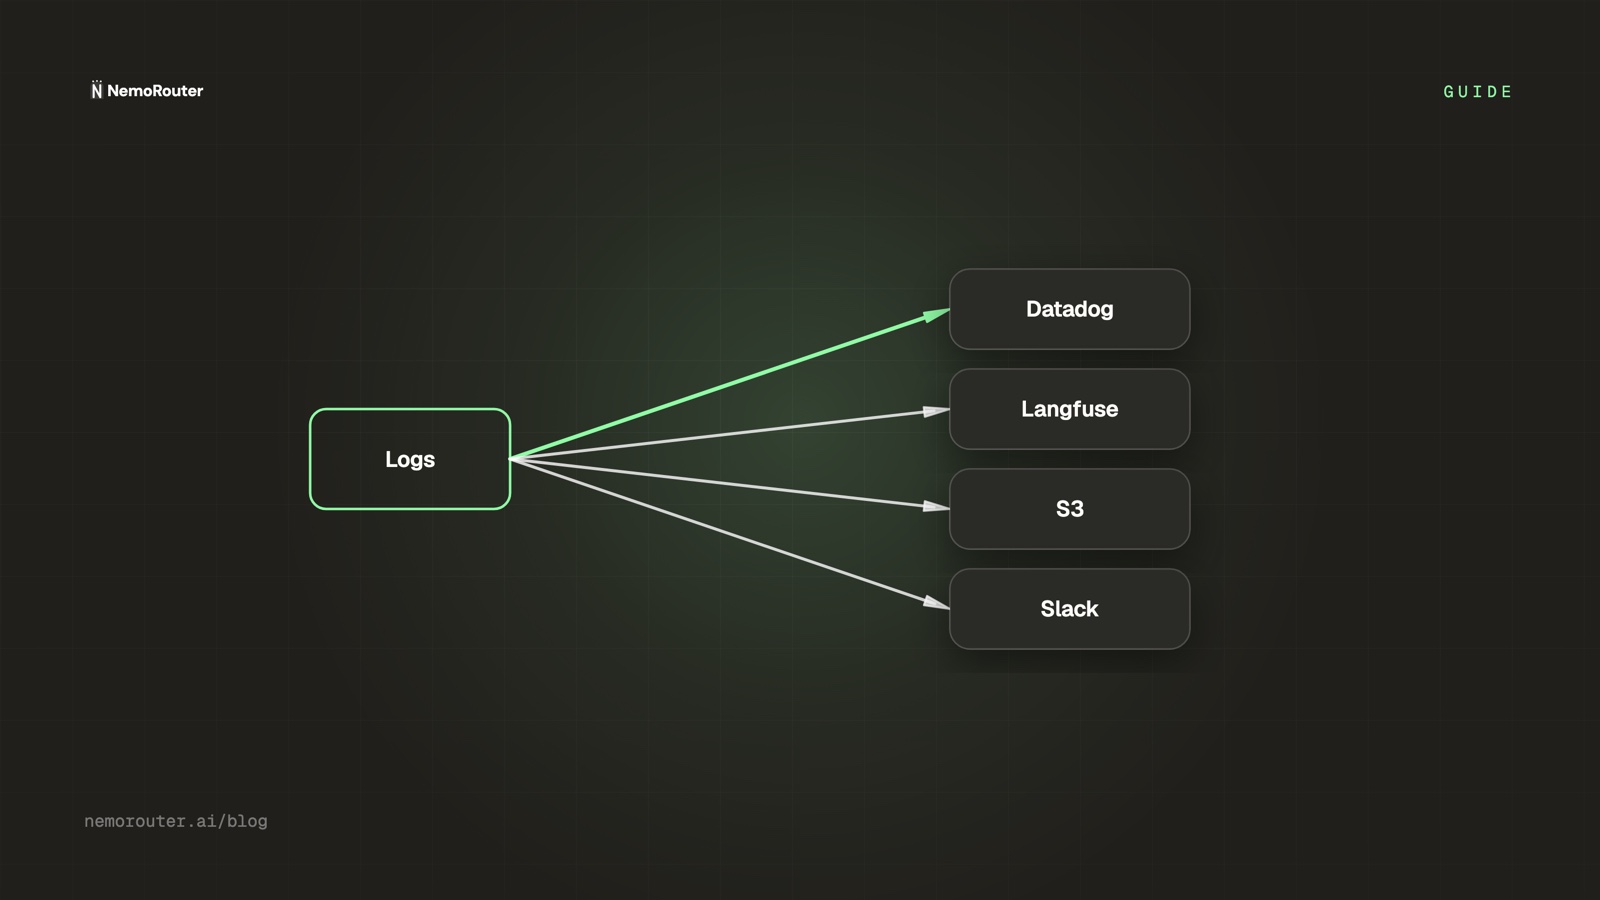
Configure log destinations once at the gateway instead of instrumenting every call site. Here is how to add and verify a callback today, what the Beta does and does not deliver yet, and the live paths that get data out in the meantime.
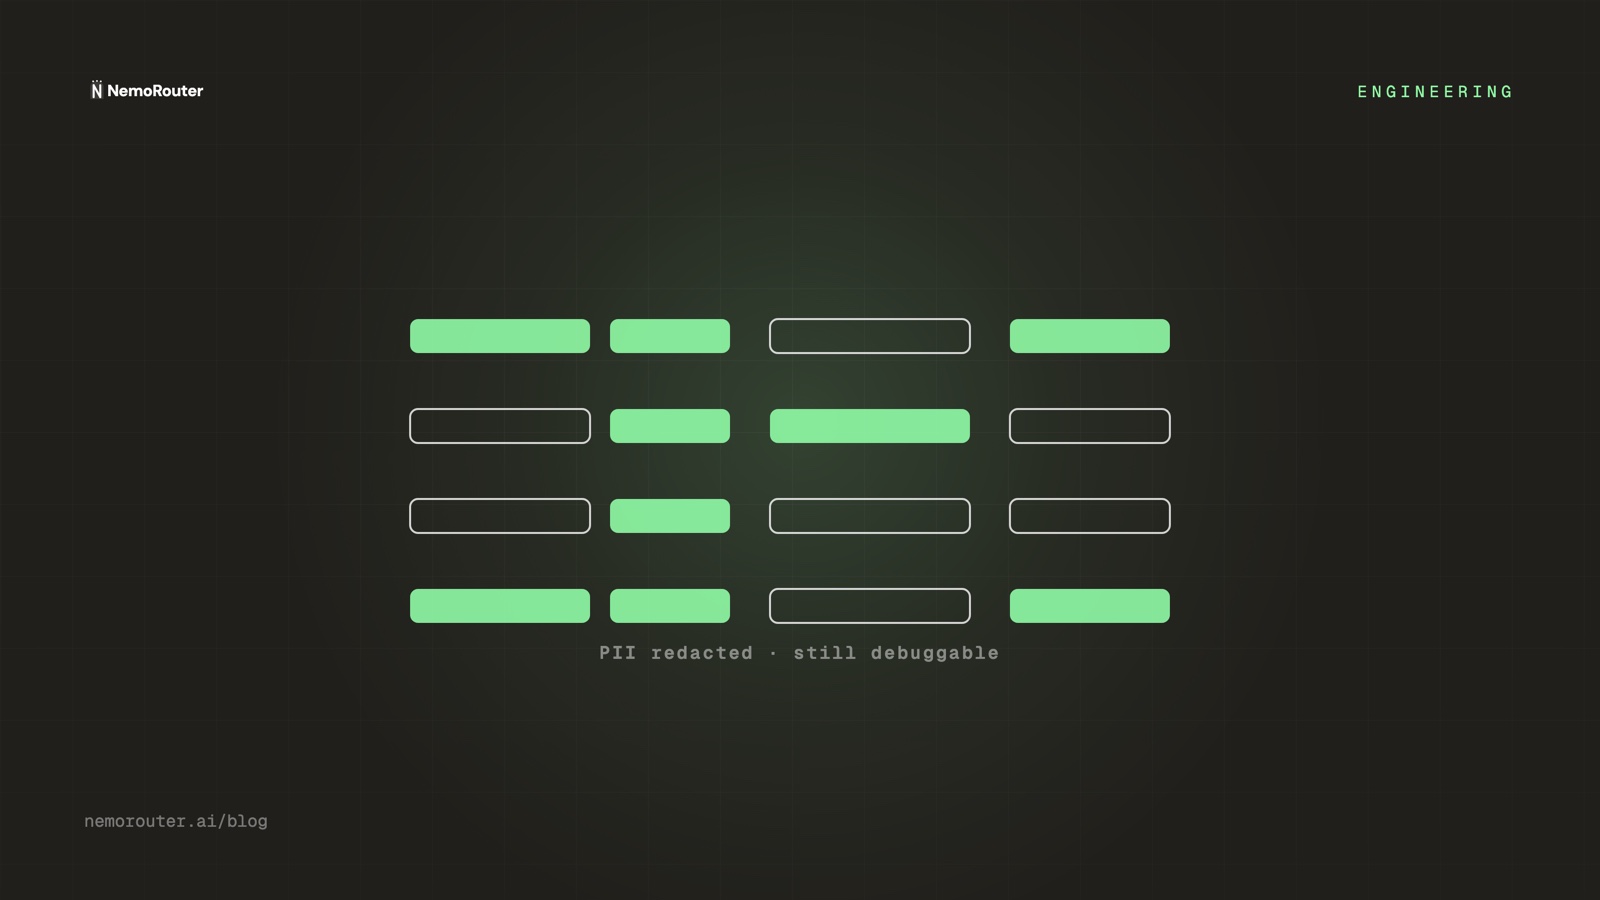
Learn how write-time redaction, typed placeholders, and metadata scrubbing keep LLM request logs fully debuggable without storing sensitive customer PII.
The fields that make an LLM request log worth keeping, the content that turns it into a liability, and how a gateway's built-in logs compare with running your own self-hosted trace store.

Why average LLM latency misleads, how to analyze p50/p95/p99 distributions and time-to-first-token, and how to isolate tail delays across model providers.
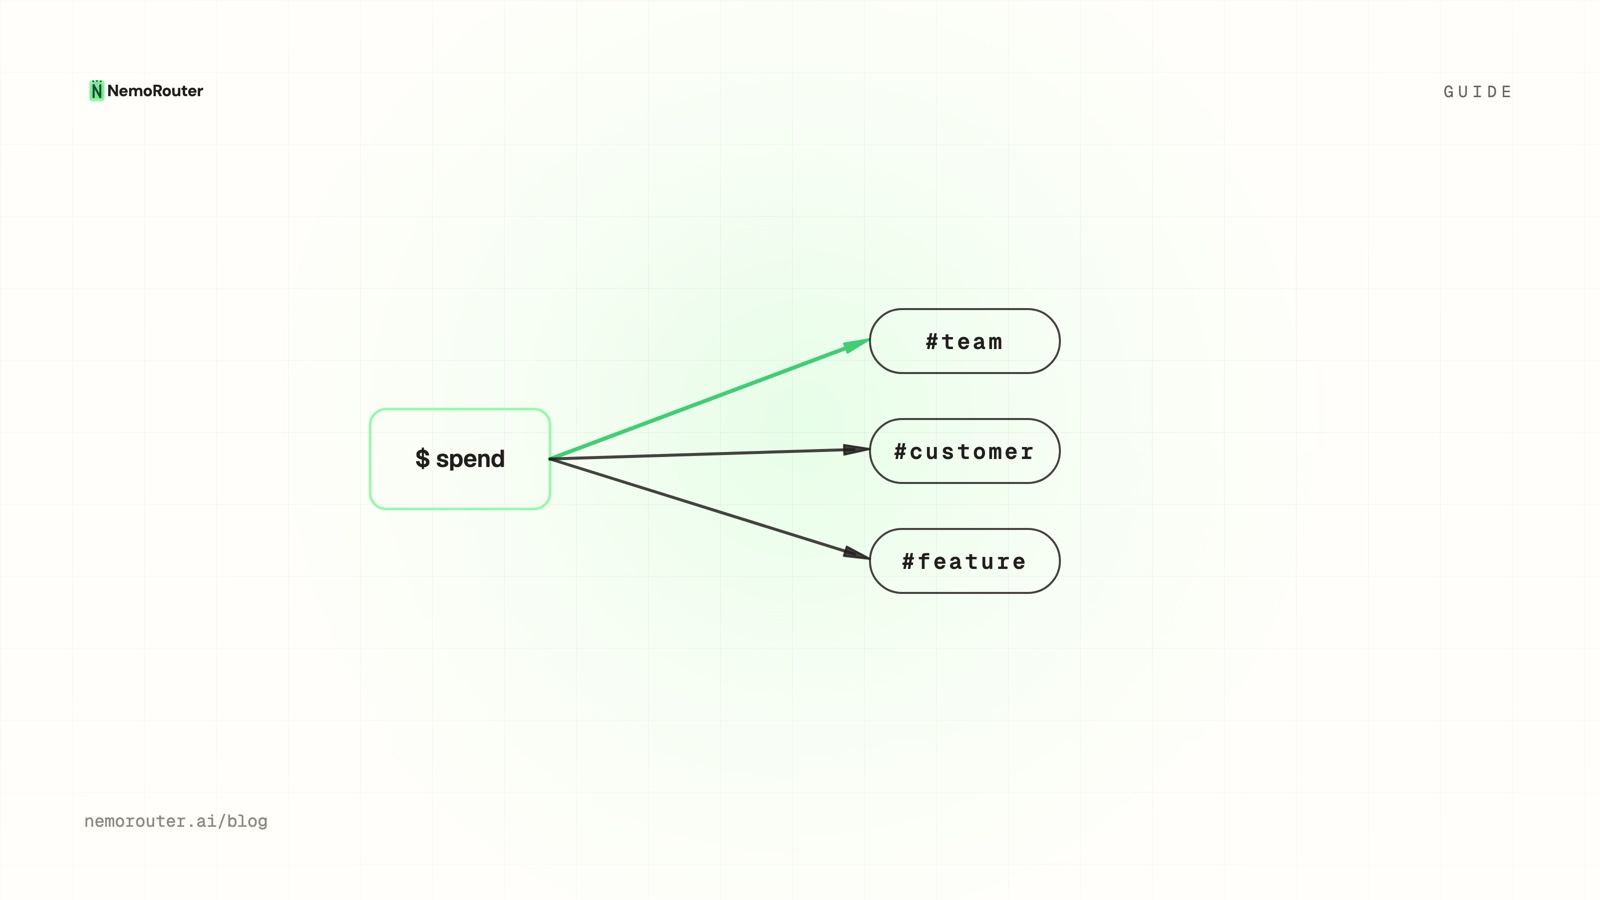
"The AI bill went up" becomes a query once spend carries structure. Three attribution layers — virtual keys, teams, and the OpenAI-spec user field — turn one opaque total into a breakdown you can group, filter, and cap.
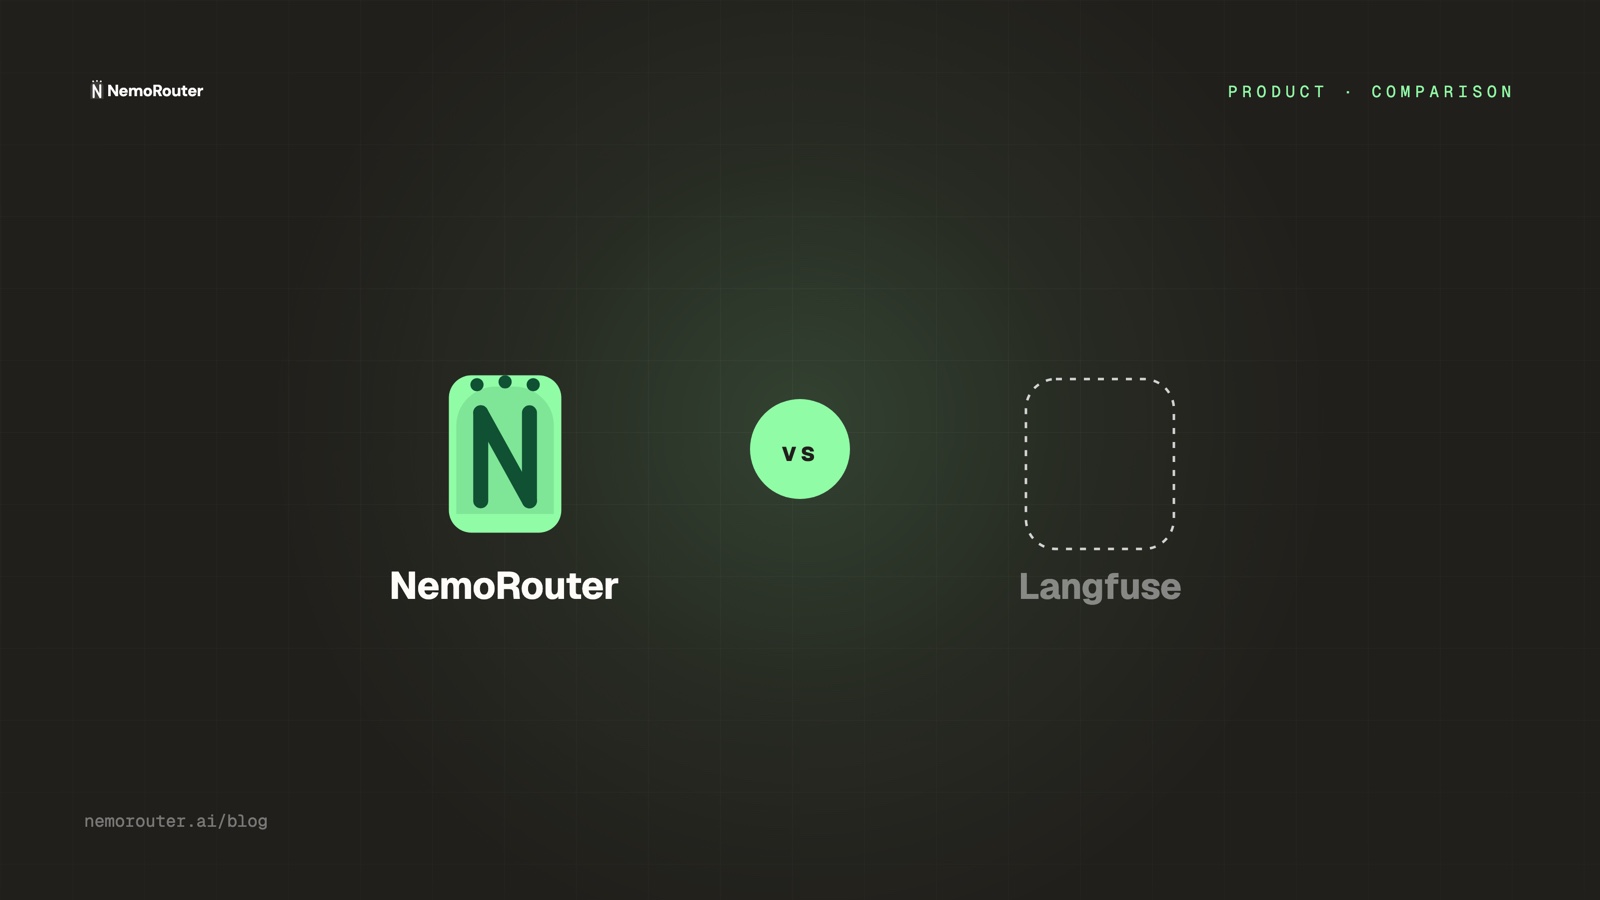
Head-to-head: nRouter vs Langfuse. A self-hostable observability + prompt + evals specialist vs a hosted LLM gateway that bundles observability, routing, and governance — every feature included on every plan. Platform fee of 4% of your credits on every plan. Models available in your live catalog behind one API key.
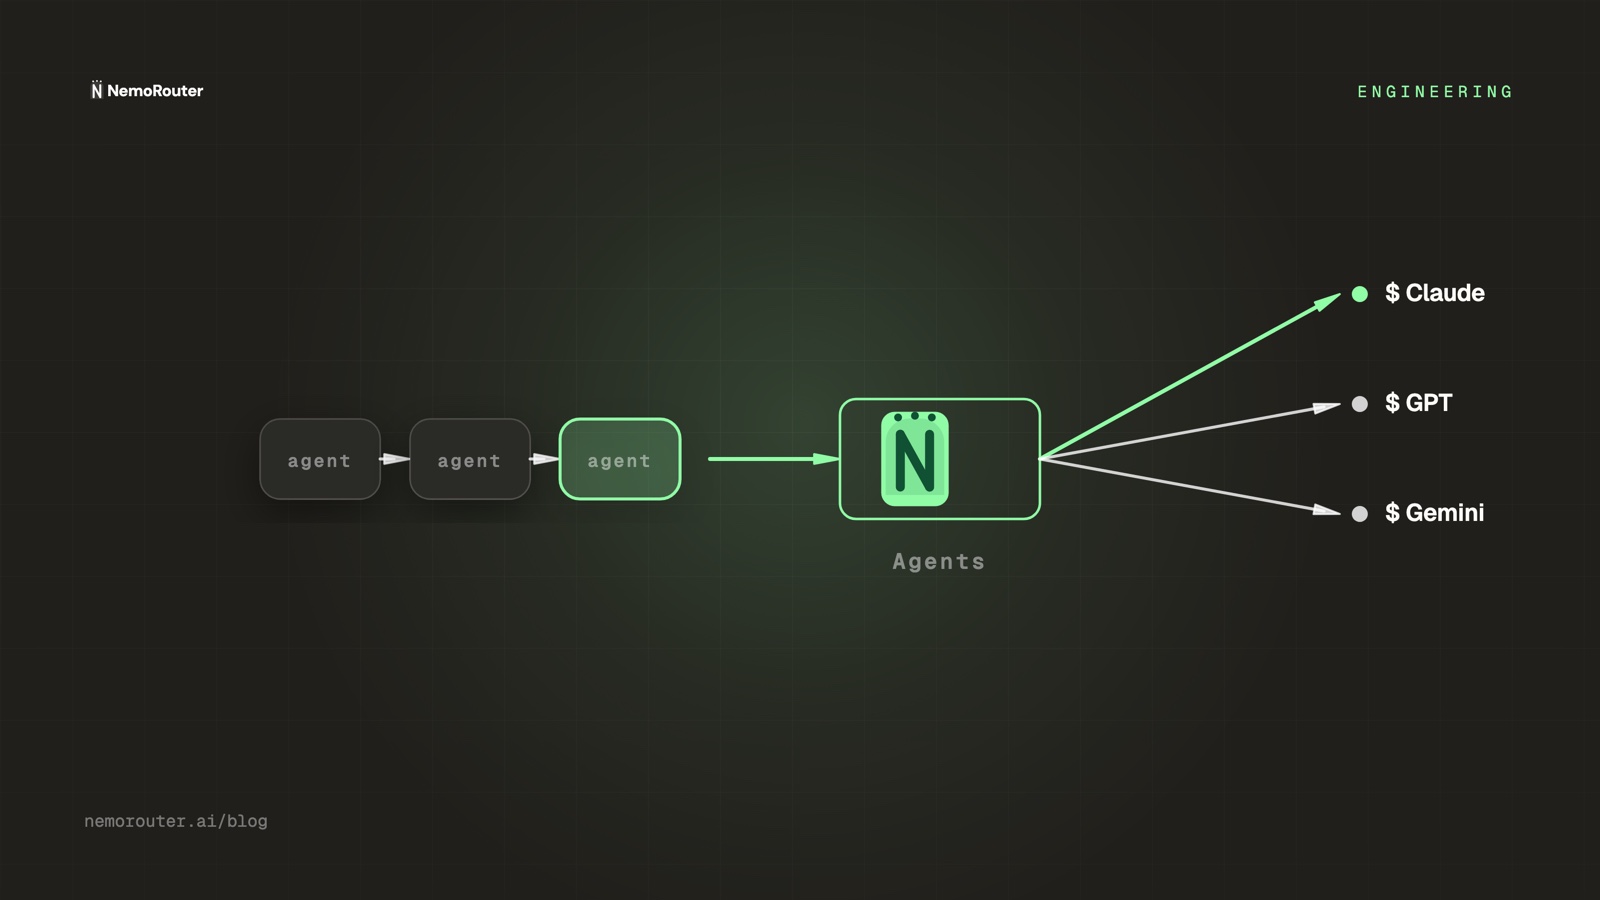
Attribute LLM spend across multi-agent workflows by role, run, and step, reconcile usage against the credit ledger, and enforce hard gateway budget caps.