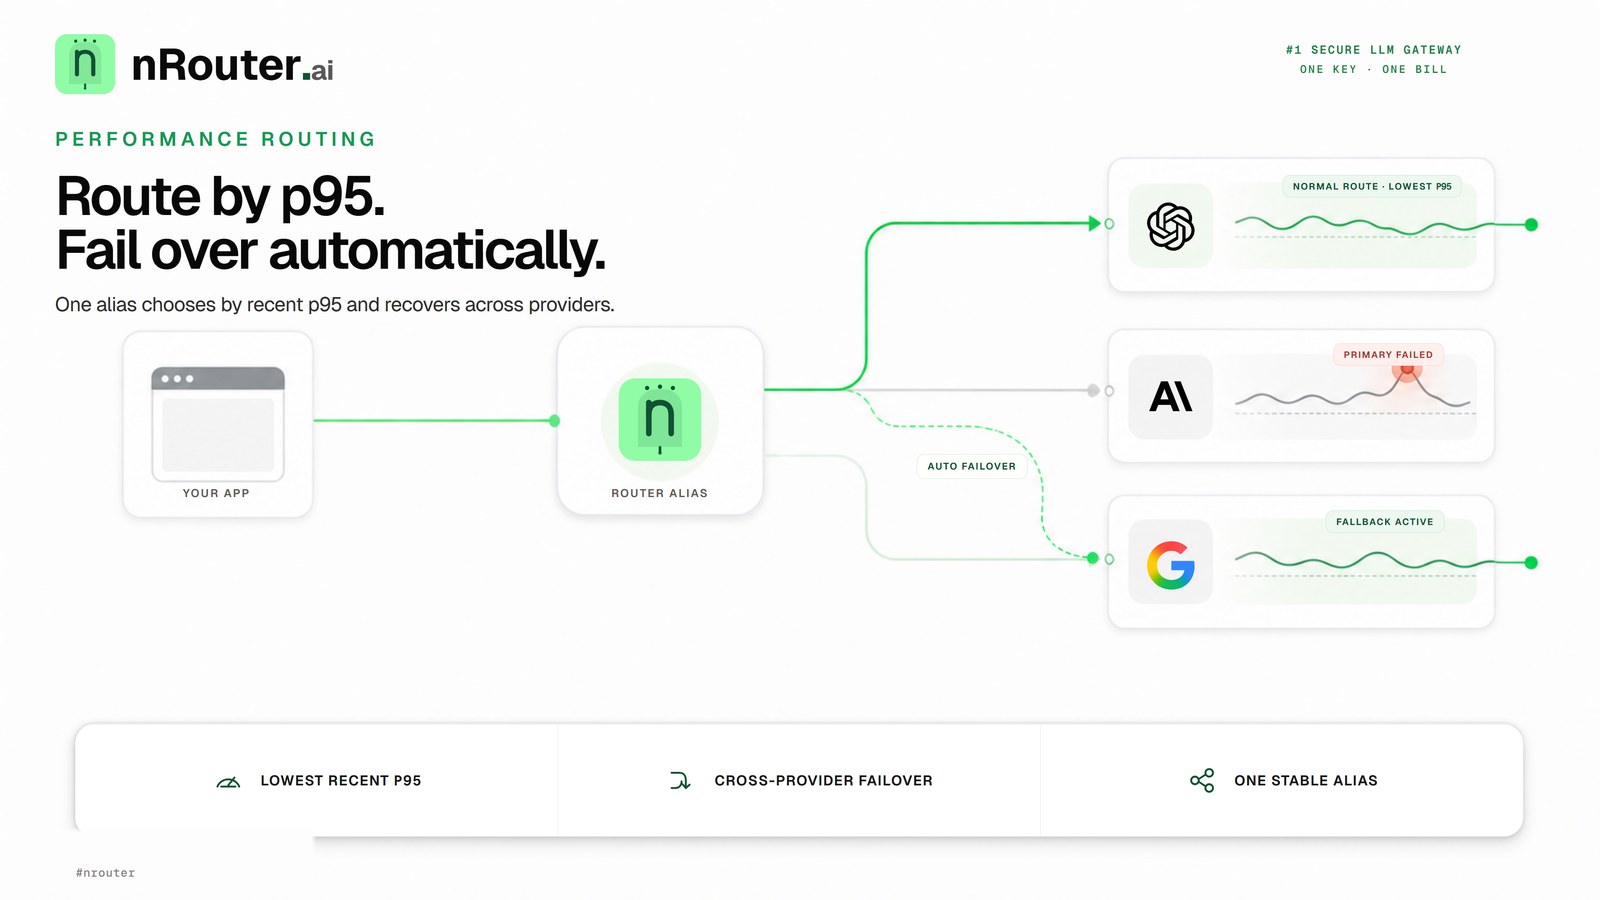
The Direct Answer: Reporting arithmetic mean latency for LLM workloads obscures production failures because response times are heavily right-skewed by token length variance and provider queues. Engineering teams must measure latency percentiles (p50 for median UX, p95 for contractual SLOs, and p99 for outlier debugging) while decoupling Time-to-First-Token (TTFT) from generation duration. Widening gaps between p50 and p99 immediately identify provider degradation and retry loops before aggregate metrics reflect an incident.
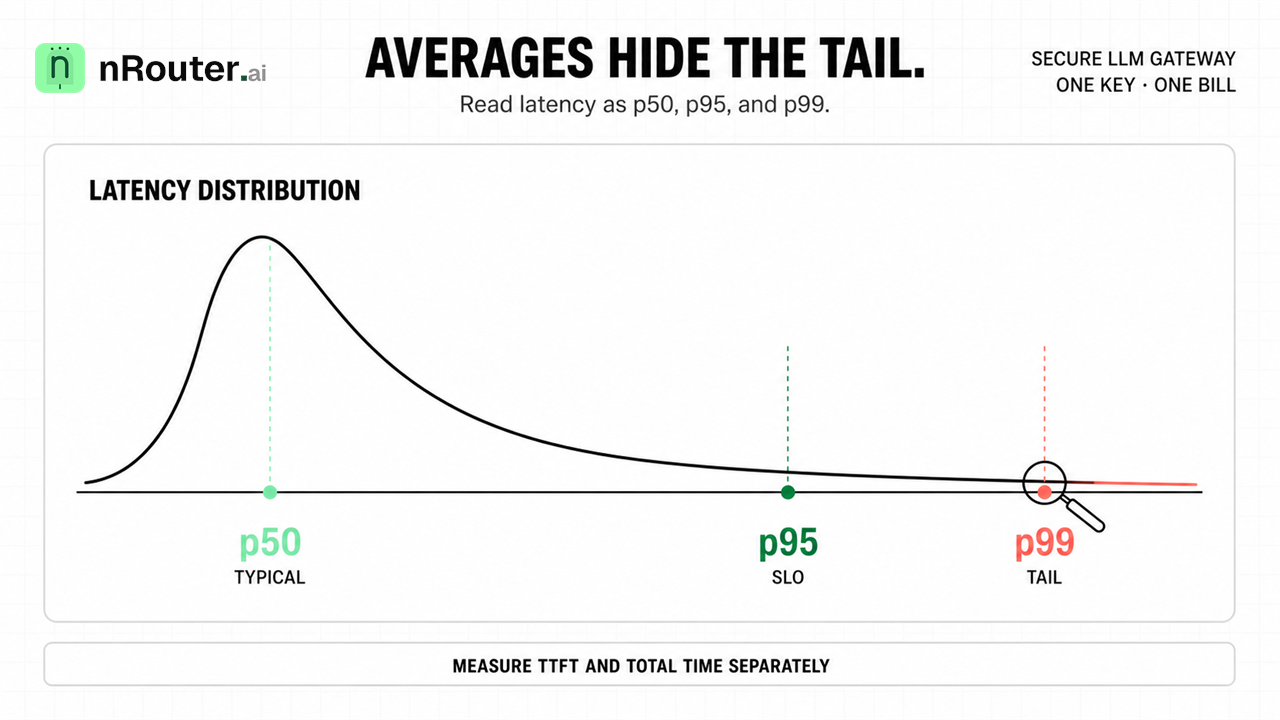
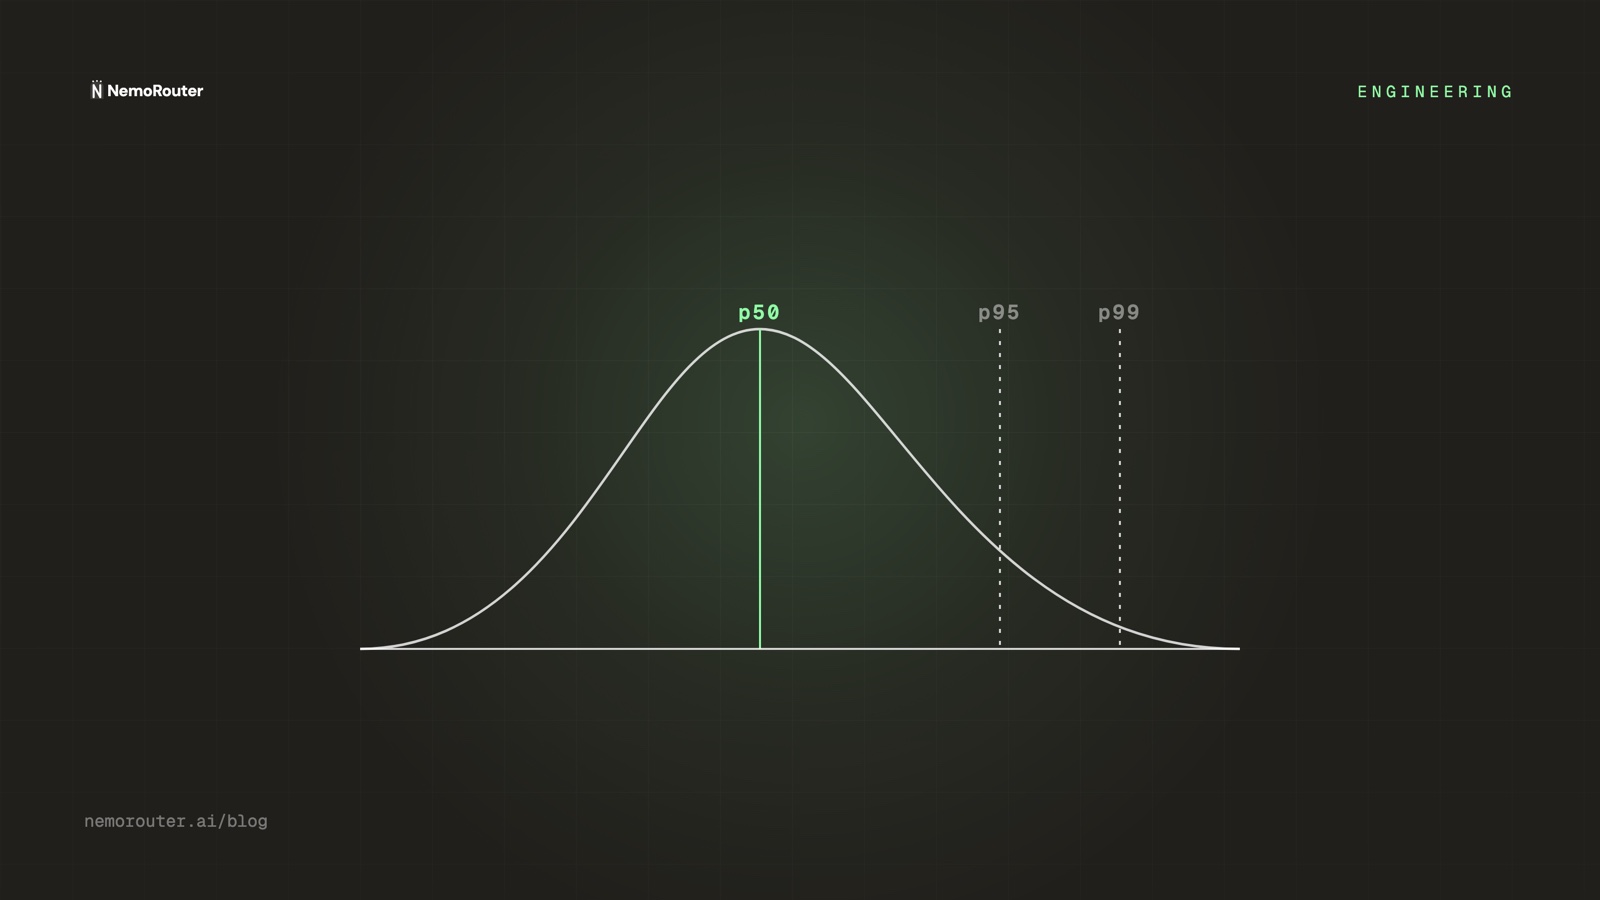
Figure 1: Latency Distribution vs Mean — Visualizing right-skewed tail latency and isolating Time-to-First-Token (TTFT) from stream generation duration.
The answer: measure LLM latency as a distribution, not a mean. Track p50 for the typical call, p95 for your SLO, and p99 for the calls that decide whether users trust the product — split by model and by route, with time-to-first-token measured separately from total completion time. Watch the p50-to-p99 gap: when it widens, something is going wrong intermittently, and the mean will not show it.
Latency is the one metric where the summary statistic most teams reach for is actively misleading. If your dashboard shows a single average response time for LLM calls, you are looking at a number that describes no request anyone made — and specifically, it is designed to hide the requests that are costing you users. The person staring at a spinner is in the tail. The mean's entire job is to average the tail away.
This post is how to measure LLM latency honestly: what each percentile answers, why streaming splits the question in two, the measurement decisions that change the numbers, and how to walk a bad tail back to its cause.
The request that ruins the demo
A prospect is on a call with your product. They type a question into your AI feature. Ten seconds pass with a spinner. They say "is it always like this?" and you say "no, usually it's about half a second."
You are both right, and that is the problem. Here are ten real calls to the same endpoint, in milliseconds:
180, 190, 200, 210, 220, 230, 250, 300, 900, 2400

mean = 508 ms   ← no request was anywhere near this
p50  = 225 ms   ← the typical request
p90  = 900 ms   ← where it starts hurting
p99  ≈ 2400 ms  ← the request that ended the demo
The mean sits at 508 ms — a value that eight of the ten requests beat comfortably and two of them missed by a mile. It is not a compromise between the fast and slow requests so much as a number that belongs to neither group. Your dashboard says 508 ms. Your prospect experienced 2,400 ms. Nobody is lying and nobody learns anything.
Why the average lies
Latency distributions are right-skewed and unbounded on one side. A request cannot take less than zero milliseconds, so the fast side is compressed against a floor, while the slow side has no ceiling at all — a retry, a cold route, an oversized prompt, and you are three seconds out. There is no symmetric population of impossibly fast requests to balance the slow ones, so the mean drifts upward with the tail while describing the tail badly.
LLM traffic makes this worse than a typical web service, for reasons specific to the workload:
- Output length is a variable, not a constant. A 40-token answer and a 1,500-token answer are the same endpoint, the same model and wildly different wall-clock times.
- Prompt length is a variable too. Long context inflates the time before the first token appears, independently of how much output is generated.
- Providers have their own tails. You inherit the upstream distribution and add your own on top.
- Retries multiply. A call that succeeded on its second attempt spent two calls' worth of time.
So use percentiles, which are order statistics and therefore immune to how extreme the extremes are:
| Percentile | Reads as | Use it to |
|---|---|---|
| p50 (median) | "the typical request" | Track the common-case experience |
| p95 | "1 in 20 is at least this slow" | Set and defend an SLO |
| p99 | "1 in 100 worst case" | Find tail causes: big prompts, retries, cold routes |
| p99.9 | "1 in 1,000" | Only meaningful at high volume; noisy below it |
The single most useful derived number is the p50-to-p99 gap. A healthy system has a tight one. A widening gap means something is occasionally going very wrong while the median stays reassuringly flat — which is exactly the failure mode that reaches you as a customer complaint rather than an alert.
Time-to-first-token is a separate number
Streaming gives LLM latency a dimension that ordinary request/response services do not have. There are two clocks, and conflating them is how a product that benchmarks fine still feels slow:
- Time-to-first-token (TTFT) — from request sent to the first content token arriving. This is the perceived-responsiveness number. It is what the spinner measures, and it is dominated by prompt processing, queueing and connection setup.
- Total completion time — from request sent to the stream closing. This scales with output length, and it is the number that matters for batch jobs, evaluation runs and agent steps where nothing is displayed until the step finishes.
The two decouple in both directions. A model can start streaming almost immediately and then take twelve seconds to finish a long answer — great TTFT, poor total. Another can think for two seconds and then emit a short answer in 200 ms — poor TTFT, good total. If your product streams to a human, optimise TTFT. If your product is an agent loop where the next step cannot start until this one finishes, optimise total. Averaging the two into one "latency" number optimises neither.
Never percentile across models
A single p95 over all traffic blends a small fast model with a large flagship and produces a number that is true of nothing and actionable for no one. Percentile per model and per route, then compare. The cause of a bad p99 is almost always specific to one model or one prompt shape, and it is invisible in the blended figure.
The mechanism: one clock, every request, no sampling
Measuring at the gateway is not a convenience, it is what makes the numbers comparable. When each service times its own provider calls, you get as many definitions of "latency" as you have services: one starts the timer before serialisation, another after; one counts the retry, another reports only the successful attempt; one uses the client's clock and another the container's. Comparing a p95 from one to a p95 from the other is arithmetic on incompatible quantities.
A single measurement point fixes the definition. Three properties are worth stating as promises:
- Same clock, every provider. The timer starts when the request is accepted and stops when the response is complete, using one clock for every upstream. A comparison between providers is then a real comparison.
- Every request in the denominator. Percentiles are computed over all traffic, not a sample. Sampling is where tails go to die: at a 1% sample rate, your p99 is estimated from the requests you happened to keep, and the interesting ones are rare by definition.
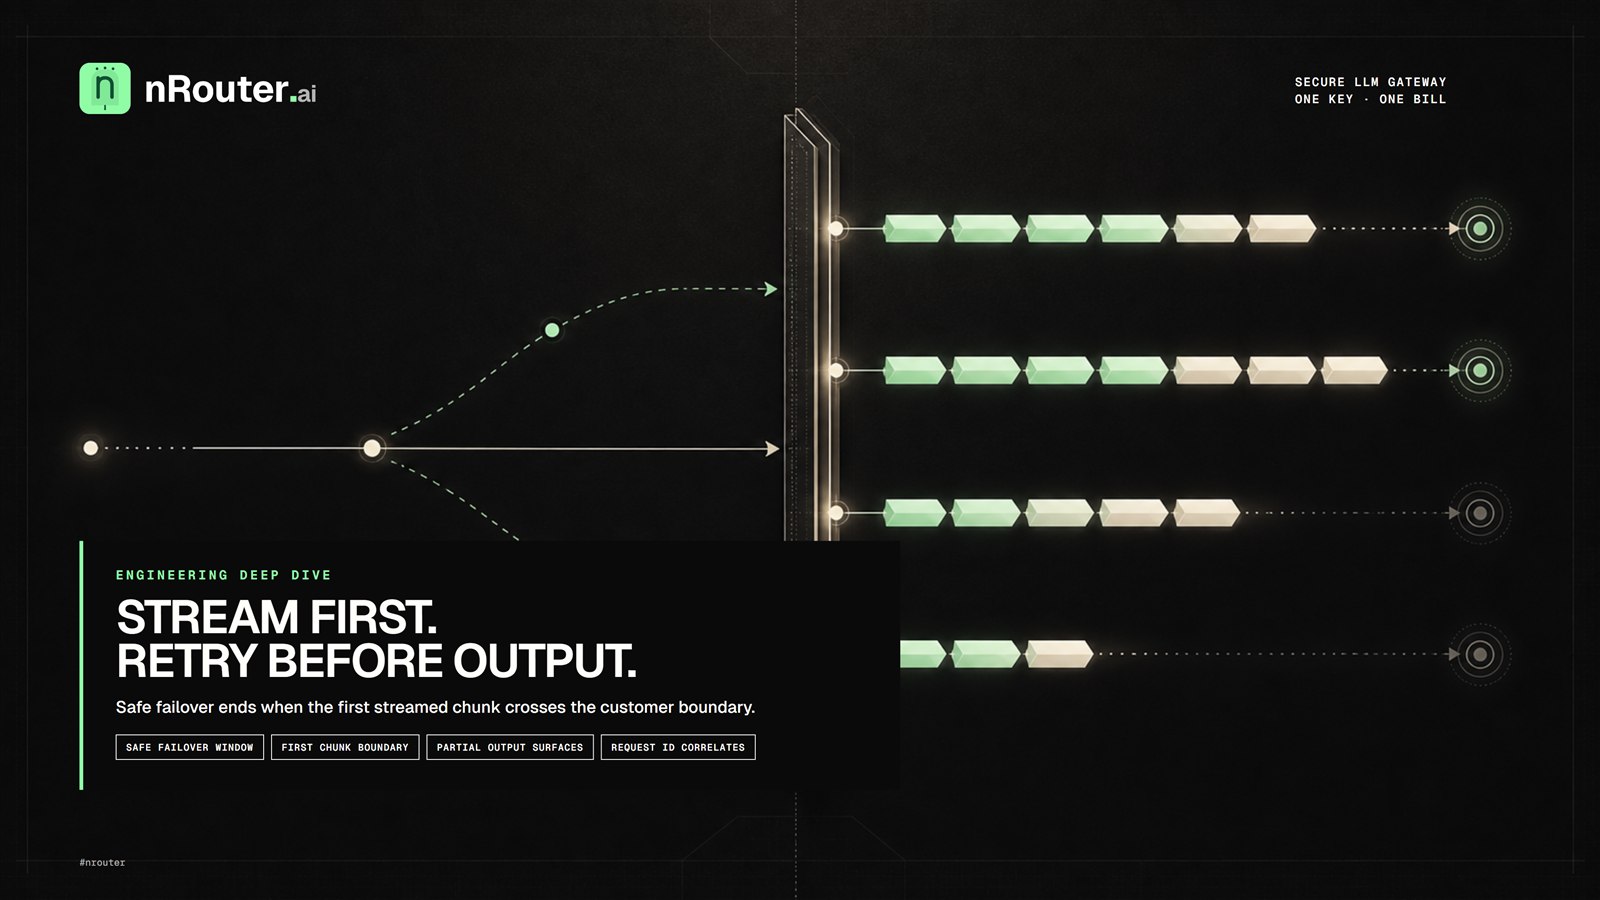
- Attempts are visible, not collapsed. A request that failed over to a second provider took the time it took. Hiding the first attempt would make the tail look better and the diagnosis impossible.
You also do not have to wait for an aggregate to investigate a single complaint. Time the call where you make it — a wall clock around the request — and record the x-nr-request-id from the response next to that measurement. The id identifies that exact call in the request log and in any support conversation, which turns "it was slow on Tuesday" into one specific request somebody can look up.
Worked example: a fast model and a flagship, side by side
Say you run the same feature through a small fast model and a flagship, and over a week each handles a comparable share of traffic. Blended, the dashboard reports a p95 of 1,900 ms and everyone shrugs. Split, it looks like this:
| Metric | Small model | Flagship | Blended |
|---|---|---|---|
| Requests | 62,000 | 58,000 | 120,000 |
| p50 TTFT | 210 ms | 640 ms | 380 ms |
| p95 TTFT | 480 ms | 2,050 ms | 1,900 ms |
| p99 TTFT | 690 ms | 7,400 ms | 5,800 ms |
| p50 total | 900 ms | 2,300 ms | 1,400 ms |
| p95 total | 1,600 ms | 6,900 ms | 5,700 ms |
| p50→p99 gap | 3.3× | 11.6× | 15.3× |
Now the blended p95 is exposed as a fiction. The small model is comfortably inside any reasonable SLO. The flagship's p99 TTFT is 7.4 seconds — more than ten times its own median — which is not a "slow model" story, it is an intermittent story. Something is happening to roughly one flagship request in a hundred that is not happening to the other ninety-nine.
The arithmetic to do next is a share-of-badness calculation. If 58,000 flagship requests have a p99 of 7,400 ms, then about 580 requests per week took at least that long. If your feature is used by 2,000 people a week, a meaningful fraction of them met a seven-second spinner at least once. That is the number that justifies engineering time, and you cannot compute it from a mean.
Reading a bad tail: four suspects, in order
When the p99 is bad and the p50 is fine, work the list in this order. It is sorted by how often it turns out to be the answer.
-
Oversized prompts. Long context inflates TTFT roughly with input size. Check whether the slow requests are the big-context ones — if the p99 requests correlate with prompt length, you have found it, and the fix is retrieval discipline rather than a faster model. An LLM Gateway for RAG covers keeping the retrieved context tight.
-
Fallbacks firing. A primary provider erroring and a secondary picking up adds a full round trip to that request. A p99 spike that lines up with a provider incident is almost always this, and it is working as designed — the request succeeded that would otherwise have failed. Provider Fallback Chains explains what the chain costs you in latency and what it buys.
-
Retries. Client-side and gateway-side retries both stack wall-clock time. A request that retried twice is three requests' worth of latency reported as one. If your client library retries on
429, its retries are invisible to your own timers but very visible to your user; Handling 429 and 402 Errors covers reading those responses properly, and RPM and TPM Rate Limiting covers not generating them in the first place. -
Cold routes. The first request to a sparsely used model or region pays setup costs the hundredth does not. This shows up as a tail that correlates with time-of-day rather than with payload, and it usually shrinks on its own as traffic grows.
Edge cases we had to decide
-
When a request fails over, we report the total elapsed time, not the successful attempt. The user waited for both. Reporting only the winning attempt would produce a flattering p99 that no human ever experienced, and it would erase precisely the signal that says "your fallback chain is being exercised".
-
When a response is streamed, TTFT and total are recorded as separate quantities and never averaged into one. A single blended "latency" for a streaming call is not a measurement of anything a user perceives. Two numbers is the honest answer even though it makes the dashboard slightly busier.
-
When a request is blocked before it reaches a provider, it does not enter the model's latency distribution. A budget refusal or a guardrail block is fast by construction, and letting a flood of instant
4xxresponses into the same histogram would improve every percentile while the service got worse. Refusals are counted, and counted separately. -
When traffic is low, we widen the window rather than reporting a confident p99. A p99 over 40 requests is the second-slowest request wearing a statistical costume. Percentiles need volume to mean anything, and a stable-looking number computed from too few samples is worse than an honest gap.
-
When percentiles are aggregated over time, we do not average them. The mean of Monday's p95 and Tuesday's p95 is not the week's p95 — percentiles are not additive. Aggregating requires the underlying distribution, which is the reason the measurement keeps the whole distribution rather than only the summary.
Coordinated omission, the classic trap
If your load generator waits for each response before sending the next, a slow response suppresses the requests that would have been sent during the stall — so the very period you most want measured contributes the fewest samples. Gil Tene named this coordinated omission, and it is why a benchmark can report a beautiful p99 for a system that stalls regularly. Measuring at the gateway, on real traffic, from request acceptance rather than from request dispatch, avoids the open-loop version of this trap.
What you see from the outside
Per request, on every response:
| Header | What it tells you |
|---|---|
x-nr-request-id | Always present; the identifier to quote in a ticket |
x-nr-model | Which model actually served it — not always the one you asked for |
x-nr-request-cost | USD cost — absent when the cost is not known, never sent as 0 |
That last row matters when you correlate latency against spend: an absent cost header is a fact you can branch on, whereas a zero would be a false claim that a call was free. The distinction is argued in full in Cost Honesty.
Timing is not one of the response headers. For a single call, measure it yourself around the request and key that number to the x-nr-request-id you read off the response; for the distribution, use the analytics surface, which measures every request at the gateway on one clock.
In aggregate, the analytics surface reports p50, p95 and p99 alongside throughput and error rate, sliced by model, by key and by team, over every request rather than a sample. The configuration and field reference lives in Analytics, the broader signal model in Observability, and threshold notifications in Alerts. The full response-header table is in the chat completions API reference.
Limits
Gateway latency is not end-user latency. What is measured here is request-accepted to response-complete. Your user's experience also includes their network, your own application's work before and after the call, and browser rendering. The gateway number is the part you can attribute to inference; treat it as a component of a client-side measurement, not a substitute for one.
A percentile is a description, not a diagnosis. p99 tells you that something is slow one time in a hundred. It does not tell you which thing. That is why the split-by-model, split-by-route discipline in the worked example is not optional — the aggregate number's only job is to tell you where to look next.
Provider tails are not yours to fix. When an upstream provider is having a bad hour, your p99 reflects it. What you control is whether the request fails over, whether it retries, and whether your product degrades gracefully. Routing policy is the lever, and Cost-vs-Quality LLM Routing: Which Tasks Can Go Cheap covers making that trade deliberately rather than by accident.
Low-volume routes will not give you a trustworthy p99. If a route sees a few hundred calls a week, read p50 and p90 and treat the p99 as an anecdote until the volume arrives.
Try it
Send one request, time it yourself, and keep the id — no dashboard required. curl reports its own wall clock with -w, and -D - prints the response headers alongside it:
curl -sS -D - -o /dev/null \
  -w 'time_starttransfer=%{time_starttransfer}s  time_total=%{time_total}s\n' \
  https://api.nrouter.ai/v1/chat/completions \
  -H "Authorization: Bearer $NROUTER_API_KEY" \
  -H "Content-Type: application/json" \
  -d '{
    "model": "claude-sonnet-4-5-20250929",
    "messages": [{"role":"user","content":"Say hello in five words."}]
  }' | grep -iE '^(x-nr-|time_)'
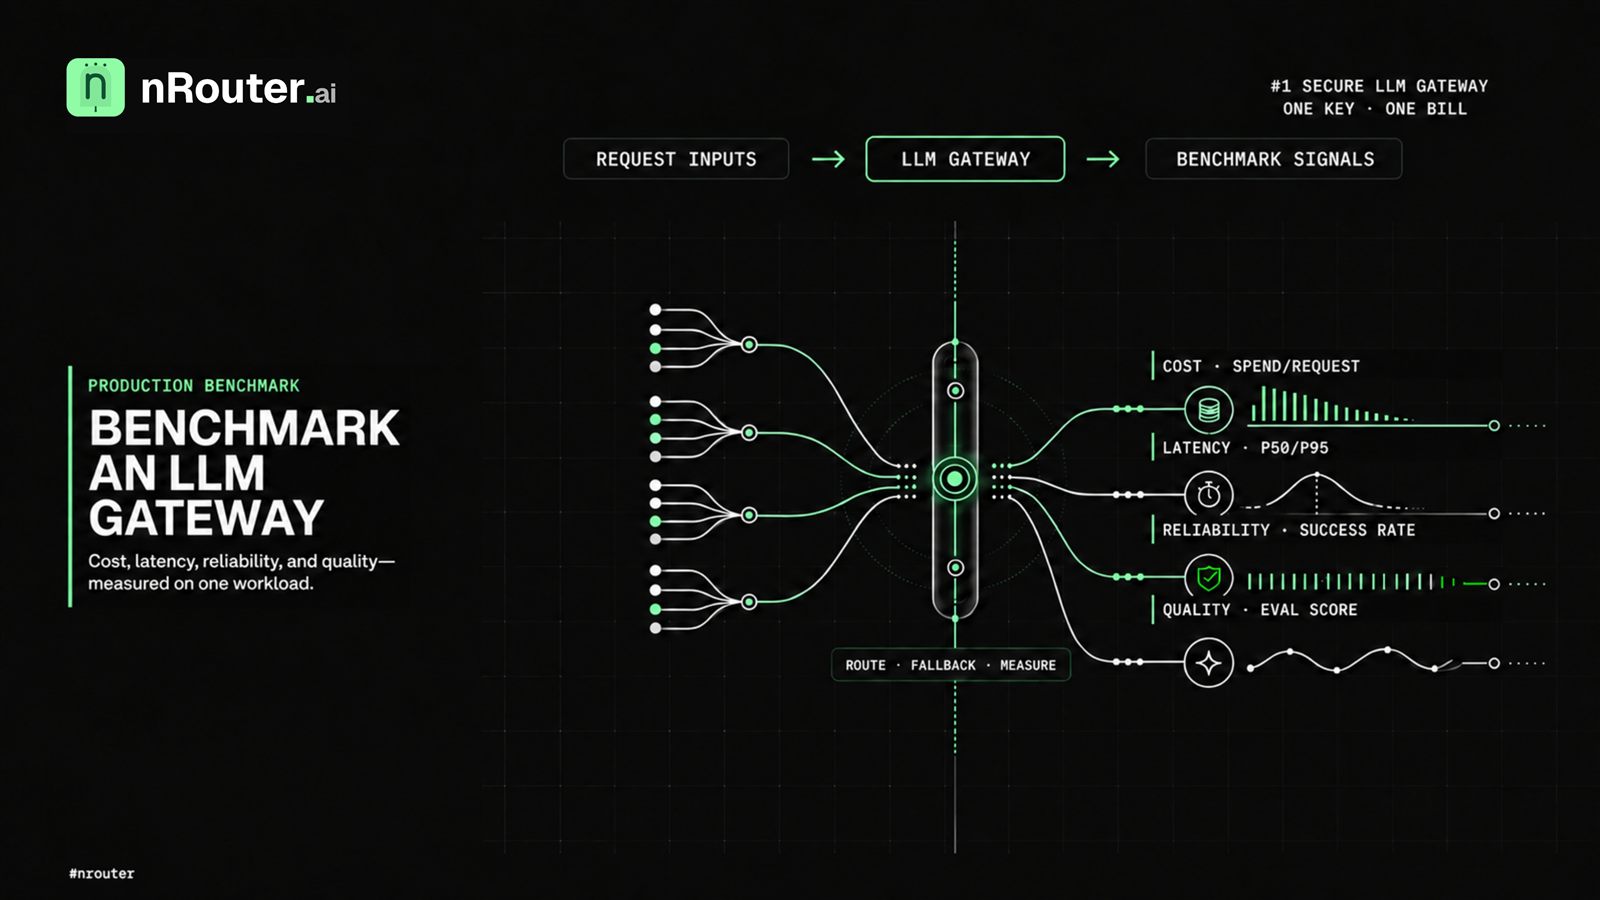
Then run the same prompt against a different model from the live model catalog and compare the two timings — same client, same network, same definition, so the comparison is real. One sample each is an anecdote, not a percentile: for the distribution, read p50, p95 and p99 off analytics, where every request is measured at the gateway on one clock. The playground is the fastest way to eyeball the difference before you wire anything up.
Pay as you go starts at $5 — a $5 minimum credit purchase with the platform fee on top, no subscription. → Get started. Bring a latency question to the nRouter community if your tail does not match any of the four suspects above.
See also
- Cost vs Usage: Finding the Quietly Expensive Model — the same split-by-model discipline applied to spend, where blended averages hide the same class of problem.
- Provider Fallback Chains: Surviving an OpenAI Outage — what a failover costs in tail latency and what it buys in availability.
- Route Requests Automatically for Better Performance — turning a latency finding into a routing policy instead of a spreadsheet.
- RPM and TPM Rate Limiting Per Key, Team, and Org — how limits shape the retry behaviour that shows up in your p99.
- What to Log (and Not Log) on an LLM Gateway — keeping the per-request detail you need to investigate a tail, without keeping what you should not.
- Inline LLM Guardrails on Every Request — the pre-flight checks that sit before the provider call and are counted separately from it.
- Models — the live catalog, so a latency comparison starts from what is actually available to you.
Sources
External references for the measurement practices above. Verified 2026-08-23. If a linked page has moved and we have not refreshed, email hello@nrouter.ai and we will re-check.
- Gil Tene, "How NOT to Measure Latency" (coordinated omission): infoq.com
- Google SRE Book, Monitoring Distributed Systems: sre.google/sre-book
- Google SRE Workbook, Implementing SLOs: sre.google/workbook
- Prometheus, histograms and quantiles: prometheus.io
- OpenTelemetry semantic conventions for generative AI: opentelemetry.io