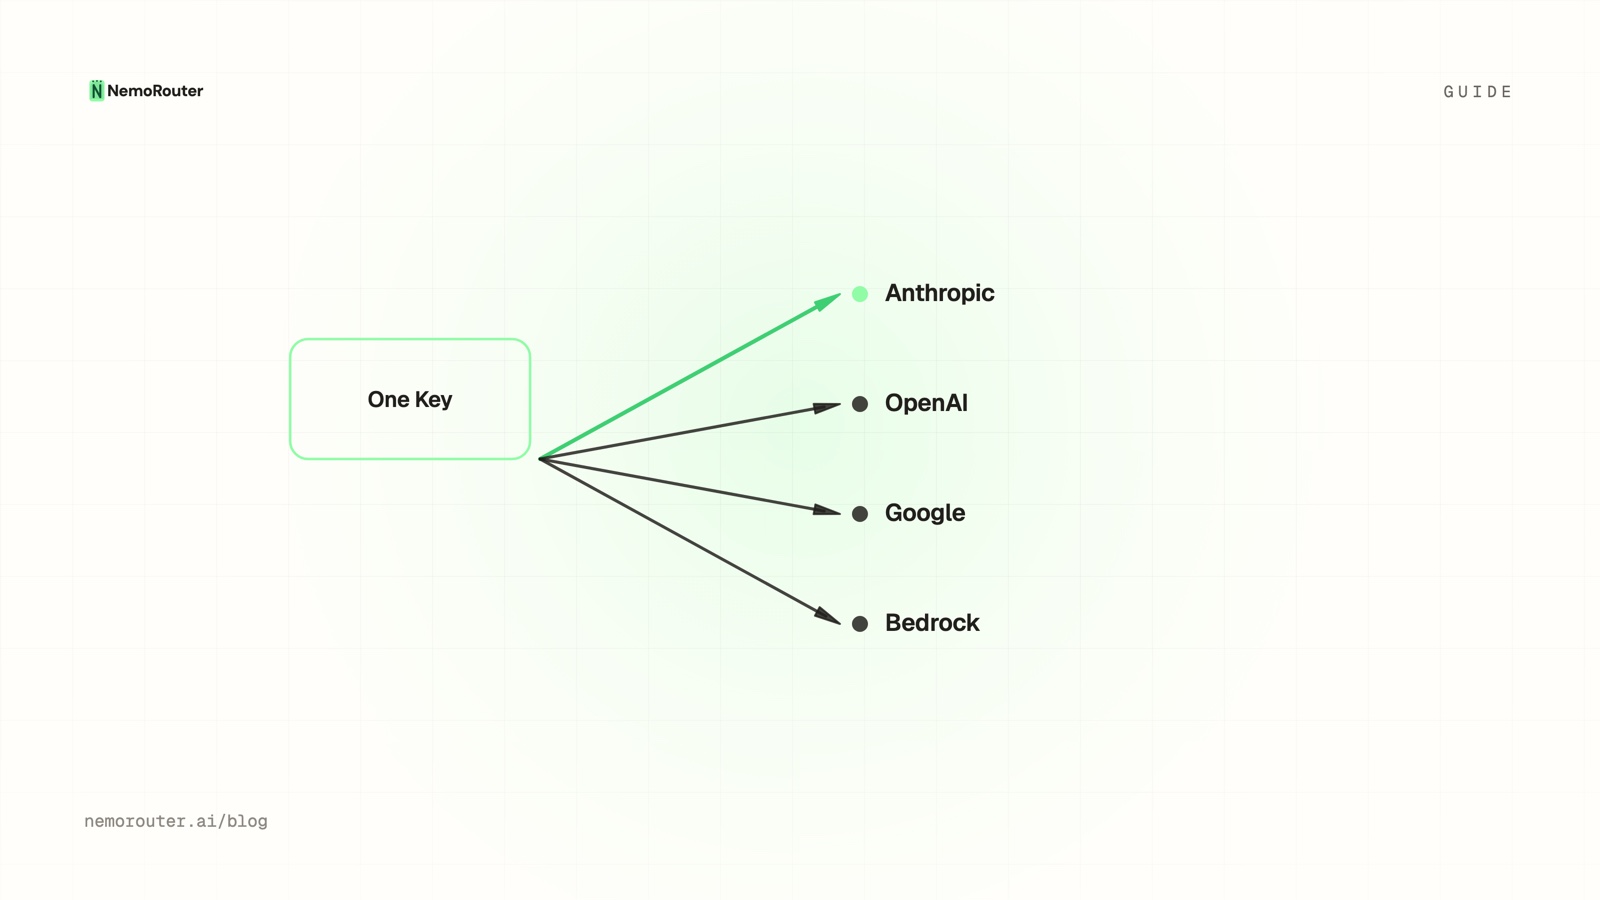
The short answer: create a router alias in Router Settings, point it at a candidate set and choose the Latency strategy — each request then goes to the model with the lowest recent p95 latency for your org. Failover is automatic and needs no configuration: a failed call is retried on an equivalent model from a different provider, and
x-nr-modelon the response names whichever model actually served it. Retries default to 3 and the timeout to 60 seconds, per org.
The short answer
Pin an application to one model name and you inherit that provider's worst day. The usual response is defensive code in every service — try A, catch the timeout, fall back to B, keep a list of which models are healthy, tune timeouts by hand. That logic rots, behaves differently in each codebase, and is close to impossible to test against a real outage, because you cannot schedule one.
Moving it into the gateway makes it one configuration instead of N implementations. This guide covers the four things that actually decide your tail latency: the routing strategy, the failover behaviour you get by default, the two org-level settings that decide how quickly a bad provider is abandoned, and the measurement that tells you whether any of it helped.
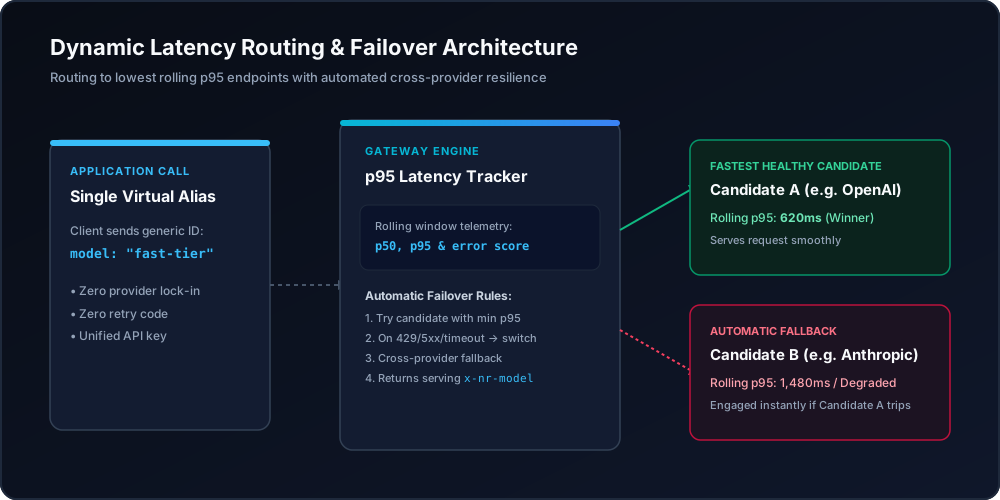
Figure 1: Latency-optimized routing architecture dispatching calls to lowest-p95 endpoints with instant failover.
When you need this
Your p95 tracks one vendor's status page. Everyday requests are fine and the tail is not, and the tail moves when a single provider has a regional wobble. Latency routing is aimed exactly at this: it moves ordinary traffic onto whichever candidate is currently quickest for you.
A rate-limit wave became a user-facing error wall. Provider limits are
per-organisation and shared across everything you run against that account —
Anthropic documents its own RPM/TPM ceilings and the 429 and overload responses
they produce at
docs.anthropic.com — so a busy
batch job can exhaust the quota an interactive surface depends on. A perfectly
healthy alternative was one HTTP call away and nothing was configured to reach
it.
Automatic failover covers this case, and it crosses providers by design — a
same-provider retry during a provider-side problem simply fails again.
Every service has its own retry helper, and they disagree. Different backoff, different timeouts, different opinions about what is retryable. Consolidating that into one org-level policy is usually a bigger reliability win than any individual tuning, because it makes the behaviour knowable.
What you need first
- An organization with credits. nRouter is credit-based and signup is card-required: the minimum purchase is $5, with the platform fee on top. See Pricing.
- Owner or admin role. Router Settings is editable by owners and admins; members and viewers see it read-only with save disabled. Roles are in Team Management.
- At least two candidate models from different providers, chosen from the live catalog at /models — each entry shows provider, mode, max tokens, cost, capabilities and current health. Anthropic, OpenAI and AWS Bedrock are live; check the catalog for the exact list your organization can call.
NROUTER_API_KEYexported. Every block below runs as written againsthttps://api.nrouter.ai/v1.
export NROUTER_API_KEY="sk-nrouter-your-key-here"

curl -sS https://api.nrouter.ai/v1/models \
  -H "Authorization: Bearer $NROUTER_API_KEY" | head -c 300
Step 1 — Baseline your latency before you change anything
You cannot claim an improvement you did not measure first, and "it feels faster" has never survived a review. Take the baseline before touching routing.
Open Advanced → Benchmark at /[organization]/advanced/benchmark. It gives a
model-by-model table on your own traffic: requests, tokens, spend, cost per 1k
tokens, cost per request, average and p95 latency, throughput in tokens per
second, error rate and cache-hit rate. The headline picks out the cheapest,
fastest, most reliable and highest-throughput model you have actually used.
Note the caveat for long windows: over six months or a year, latency columns are capped at a 90-day lookback while spend and tokens use the full window, and a note appears when that applies. Compare like with like.
Then screenshot or export the p50/p95/p99 for the model you are about to replace. Why those three percentiles and not an average is argued in measuring real LLM latency — the short version is that an average hides the exact experience you are trying to fix. Gil Tene's How NOT to Measure Latency is the canonical treatment of why, including the coordinated-omission effect that makes a load generator's own averages flatter than the truth; the Google SRE book's chapter on service level objectives is where a percentile becomes a number you can hold a service to.
Step 2 — Create a router alias with the Latency strategy
Routing is opt-in. A concrete model name you pass in the model field is
served as asked and never re-routed, which is deliberate: nothing silently changes
under an application that named a model on purpose.
On the Router Settings page, point an alias at your candidate set and choose a strategy:
| Strategy | Behaviour | Reach for it when |
|---|---|---|
| Latency | Lowest recent p95 latency for your org | Tail latency is the problem |
| Cost | Cheapest model in the set, by your list price | Unit cost is the problem |
| Weighted | Splits traffic by the weights you assign | You are deliberately holding a mix |
Aliases are per-org and resolve at request time, so the model set and the strategy are dashboard edits — no redeploy and no SDK change. Nothing is live until you click Save Changes; an unsaved-changes badge shows while the form is dirty, Reset reverts to the last saved state after a confirmation, and a saved change reaches live inference within about 30 seconds.
Your application holds one stable name:
from openai import OpenAI
import os

client = OpenAI(
    base_url="https://api.nrouter.ai/v1",
    api_key=os.environ["NROUTER_API_KEY"],
)

resp = client.chat.completions.create(
    model="fast-chat",                  # your router alias, not a provider model
    messages=[{"role": "user", "content": "Summarise this in one line: ..."}],
)

print(resp.model)                        # the model that actually served the call
print(resp.choices[0].message.content)
If you want the nRouter response headers as well as the body, ask the SDK for the
raw response rather than reaching for a .headers attribute that a parsed
completion object does not have. Latency is not among those headers, so time the
call yourself:
import time

started = time.perf_counter()
raw = client.chat.completions.with_raw_response.create(
    model="fast-chat",
    messages=[{"role": "user", "content": "ping"}],
)
elapsed_ms = (time.perf_counter() - started) * 1000

print(raw.headers.get("x-nr-request-id"))       # the join key back to the request log
print(raw.headers.get("x-nr-model"))            # the model the alias actually resolved to
print(round(elapsed_ms, 1))
print(raw.parse().model)
Choosing which tasks belong on which candidates is the sister decision to this one — that framework is cost-vs-quality LLM routing.
Step 3 — Understand the failover you already have
This is the step most teams skip, and it matters because the default is probably what you want.
Failover is automatic and requires no configuration. If the model you asked
for fails, nRouter retries the request on an equivalent model from a different
provider and returns that result. Your code does not change, and the response
names what actually served it on x-nr-model: when you called a model by name, an
x-nr-model that differs from the name you sent is the failover; when you called
a router alias, it is the candidate the alias resolved to, so compare it against
the candidate you expected. Crossing providers is the whole point: a same-provider
retry during a provider-side incident just fails again.
You can override the default with your own fallback chain — a primary model and an ordered list of fallbacks, reorderable by drag or arrow keys. Duplicate primaries are rejected, and your chain replaces the default for that model.
One property to design around: there is one chain per primary model, not one per failure type. A chain is attempted on any delivery failure — 5xx, network errors, generic exceptions, HTTP 429 and context-window-exceeded alike. If you wanted a cheaper model tried only on rate limits and never on hard errors, that is not expressible; anything you list will be attempted on both. Design the chain as "models I am happy to be served by, in order", not as an error taxonomy. The reliability-ordering argument is in provider fallback chains.
Step 4 — Tune retries and timeout, the two settings that set your tail
These two live in Router Settings, apply per org, and are the ones that actually decide how long a bad provider can hold a request.
| Setting | Default | Scope |
|---|---|---|
| Number of retries | 3 | Per org |
| Timeout (seconds) | 60 | Per org |
Neither is overridable per request: num_retries, timeout and fallbacks sent
in a request body are ignored, so your org policy always wins and one caller
cannot opt out of it. When a provider returns a Retry-After hint — the header
defined in RFC 9110, and the one
a 429 is expected to carry under
RFC 6585 — nRouter honors it.
The ordering is what surprises people. Retries happen against the requested model first, and the fallback engages only once they are exhausted. With the defaults, a hard provider outage can therefore hold a request for up to about 60 seconds before the fallback serves it. If you would rather fail over sooner than keep trying a provider that is clearly unwell, lower the Timeout — that is the knob, not the retry count.
Pick the number from the caller's tolerance, not from the provider's. An interactive chat surface where a user is watching a cursor blink should abandon a sick provider in single-digit seconds. An overnight batch can afford to wait.
While you are in the routing area, note that response caching is on by default
for identical non-streaming requests. Your organization can switch it
off in Router Settings and a single request can skip it by sending
"nrouter_cache": false in the request body. A repeat of an identical request served
from the cache is the cheapest latency win available; it is still metered and billed
like any other request, so it buys speed, not a discount.
Step 5 — Wire the alerts that tell you it stopped working
Routing that quietly degrades is worse than no routing, because it removes the
signal you used to get from your own error rate. Turn on the telemetry alerts on
the Alerts page (/[organization]/alerts). Every alert type in the catalog is
live.
| Alert | Fires when |
|---|---|
| LLM Too Slow | p95 response latency over the last 10 minutes exceeds your threshold |
| LLM Exceptions | The error rate over the last 10 minutes crosses your threshold |
| Hanging Requests | A single request runs longer than your timeout threshold |
| Outage Alerts | A single provider fails at least your threshold share of requests |
| Region Outage | A single regional endpoint fails at least your threshold share of requests |
Turning one on opens its configuration inline: set a threshold or keep the default, then pick the channels it delivers to — Email, Slack, Microsoft Teams, Jira, or a generic webhook. Channels are created under Alert Channels; until one is bound, the alert evaluates and has nowhere to deliver, which is a silent failure mode worth checking for. To pause during a maintenance window, an owner or admin switches the toggle off and back on; there is no separate snooze. Keep the set small and symptom-shaped for the reasons set out in the SRE book's monitoring chapter; reference: Alerts and Notifications.
Verifying it worked
- Confirm the alias resolves. Send one call through it and read the resolved model off the headers, timing the call on your own clock:
curl -sS -D - -o /tmp/resp.json -w 'elapsed=%{time_total}s\n' \
  https://api.nrouter.ai/v1/chat/completions \
  -H "Authorization: Bearer $NROUTER_API_KEY" \
  -H "Content-Type: application/json" \
  -d '{"model":"fast-chat","messages":[{"role":"user","content":"ping"}]}' \
  | grep -iE '^(x-nr-(request-id|model|request-cost|cost-status)|elapsed=)'
python3 -c "import json;print(json.load(open('/tmp/resp.json'))['model'])"- Compare two candidates on the same clock. Run the same prompt against each
model by name and time both calls yourself — curl's
%{time_total}is one clock, one definition, so the comparison is real in a way that two vendor dashboards never are:
for MODEL in gpt-5.4-mini claude-sonnet-4-5-20250929; do
  echo "== $MODEL"
  curl -sS -D - -o /dev/null -w 'elapsed=%{time_total}s\n' \
    https://api.nrouter.ai/v1/chat/completions \
    -H "Authorization: Bearer $NROUTER_API_KEY" \
    -H "Content-Type: application/json" \
    -d "{\"model\":\"$MODEL\",\"messages\":[{\"role\":\"user\",\"content\":\"Name three uses for a gateway. Be terse.\"}]}" \
    | grep -iE '^(x-nr-(request-id|request-cost)|elapsed=)'
done- Re-read the Benchmark report after a day of real traffic and compare p95 against the baseline you took in step 1. One day is the minimum honest window; an hour is noise.
- Confirm a failover actually occurred at least once. Search the request logs
at
/[organization]/logsfor calls where the served model differs from the one your application asked for, or watch for anx-nr-modelon a response naming a model you did not ask for. A failover path you have never seen fire is untested. - Confirm cost did not quietly move. Latency routing optimises for speed, and
the fastest candidate is not always the cheapest.
x-nr-request-costcarries the settled cost and pairs withx-nr-cost-status; when a call cannot be priced the cost header is absent and the status readsunpriced— never a zero. Watch cost per 1,000 tokens on/[organization]/advanced/cost-vs-usagefor a week after the change.
What goes wrong
You treated failover as an uptime guarantee. It retries on the next healthy provider when the primary fails, which meaningfully reduces user-facing errors. It cannot route around a problem in your own request — a malformed body, a context-window overflow that every candidate will also reject, an expired downstream dependency. Watch p95 and p99 for the real effect on your traffic.
You built a fallback chain as an error taxonomy. There is one chain per primary model, tried on every delivery failure. If a model is in the list, it will be attempted on rate limits and on hard errors. List only models you are content to be served by.
You lowered the retry count when you meant to lower the timeout. Retries run against the requested model before the fallback engages, so the timeout is what bounds how long a sick provider holds the request. Fewer retries with a 60-second timeout can still be a long wait.
You expected a per-request override. num_retries, timeout and fallbacks
in a request body are ignored by design, so one service cannot opt out of the
org's reliability policy. Change it in Router Settings, once, for everyone.
You made your cheapest flaky model both the default and the fallback. Then a bad day for that provider takes out the primary path and the recovery path together. Keep the cost decision and the reliability decision separate — the cost half is cost-vs-quality routing.
You turned on an alert and never bound a channel. It evaluates and delivers nowhere. Check every enabled alert has a channel under Alert Channels.
Try it
Routing strategies, fallback chains, alerts, guardrails, A/B tests, prompt
management and evals are included on every plan. Every plan pays the same 4%
platform fee on credits, charged on top; plans vary the monthly nrouter/auto
allowance (subscriptions from $20/mo) and the default rate limits, never the
feature set. The reasoning behind that is in
Every Feature on Every Plan: We Charge a Fee, Not a Gate.
Load the $5 minimum, take a p95 baseline, point one alias at two candidates with the Latency strategy, and compare after a day of real traffic. Start at app.nrouter.ai/signup, or race two models by hand in the Playground first. Reliability questions are welcome in the nRouter community.
See also
- LLM Latency: p50, p95, p99, and Time-to-First-Token — why an average hides the experience you are trying to fix, and how to read the percentiles you just baselined.
- Provider Fallback Chains: Surviving an OpenAI Outage — how to order a chain by reliability, then latency, then cost, and what to do about the billing of a second attempt.
- Cost-vs-Quality LLM Routing: Which Tasks Can Go Cheap — the same alias machinery pointed at price instead of speed, with the A/B step that proves a downgrade.
- RPM and TPM Rate Limiting Per Key, Team, and Org — the velocity control that decides whether a retry storm ever reaches a provider at all.
- LLM Routing for AI Agent Pipelines — routing decisions when the caller is an agent loop rather than a request handler, where one slow hop stalls the whole chain.
- Hard LLM Spend Caps at Org, Team, User, and Key Scope — the ceilings that bound a retry storm in dollars while failover bounds it in errors.
- Models — the live catalog with provider, capabilities, context window, cost and current health for every candidate.
Sources
Verified 2026-06-24; the external references were re-checked on 2026-08-23. Every strategy, default, header and alert type above comes from nRouter's own documentation, and the model names in the examples are illustrative — check the live catalog for what your organization can call today. If something has drifted, email hello@nrouter.ai and we will correct it.
- Why the tail, not the mean, is the number to route on: Gil Tene, How NOT to Measure Latency
- Turning a percentile into a commitment, and keeping the alert set small: Google SRE book, Service Level Objectives and Monitoring Distributed Systems
Retry-Aftersemantics and the429status the failover path sees: RFC 9110 and RFC 6585- A provider's own rate-limit and overload behaviour, behind step 3: Anthropic rate limits
- Router aliases, strategies, fallback chains, retries, timeout and caching: Router Settings
- Alert types, thresholds, channels and pausing: Alerts and Notifications
- Benchmark, Key Usage and Cost vs Usage reports: Analytics and Reports
- Request log fields and the request ID: Observability and Logs
- Response headers and request shape: Chat Completions API
- Model catalog fields, aliases and health: Model Catalog
- Plans and the platform fee: nrouter.ai/pricing