

Observability & Logs
Gain full observability into LLM traffic with nRouter. Inspect request logs, analyze latency, configure PII redaction, and stream logs to external SIEMs.
Last updated
Every request through nRouter is logged. The Logs page is your request-by-request view, and Log Settings lets you forward those events to the observability tools you already use.
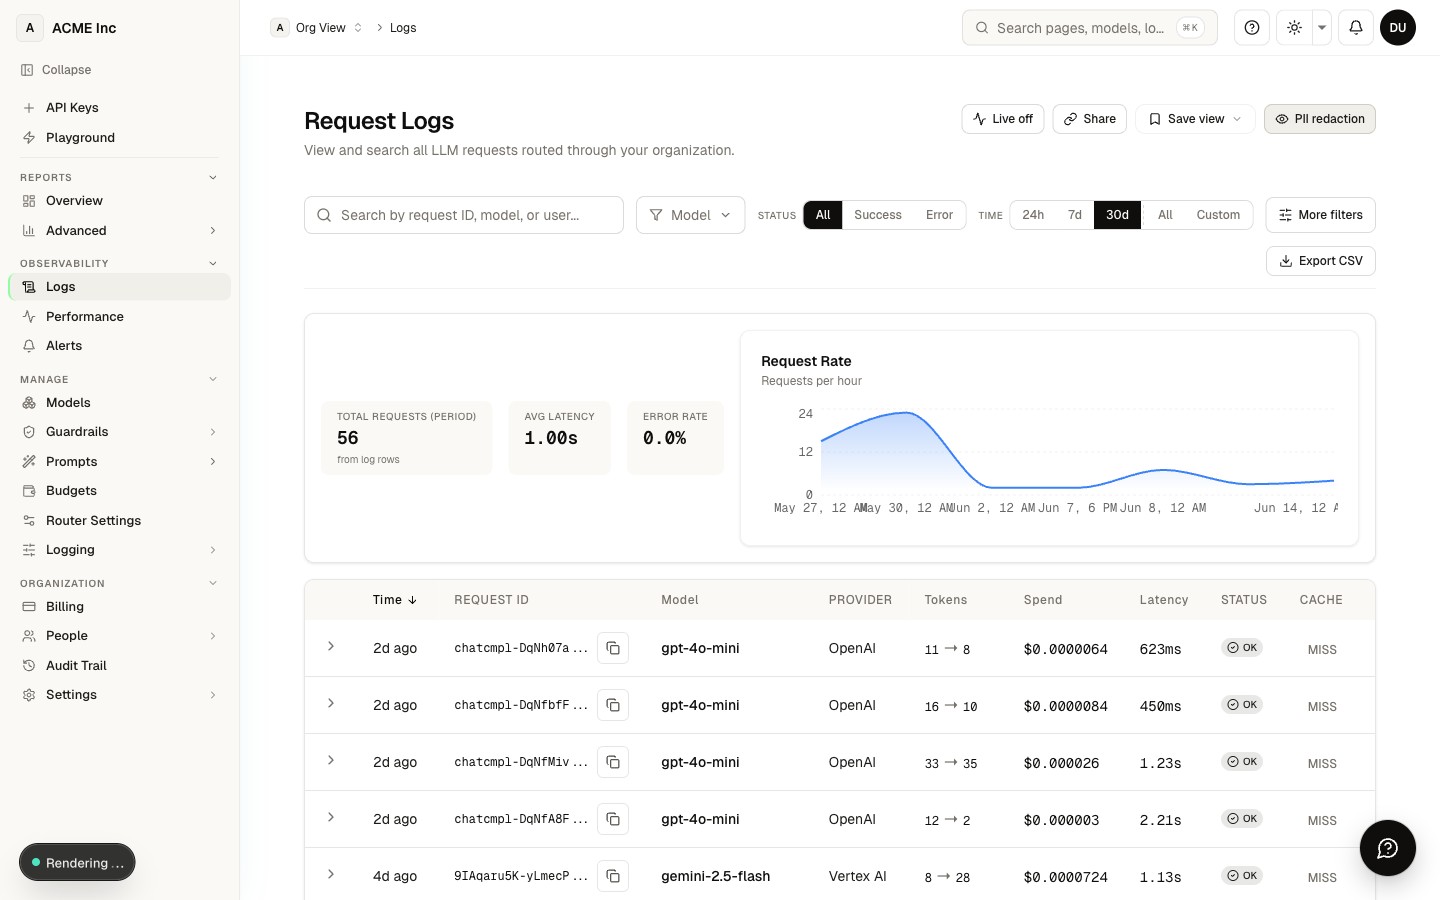
The request log
The Logs page (/logs) lists individual requests. Each row shows:
- Model and provider
- Token counts and total cost
- Latency and status (success / error)
- Cache-hit status
- Start/end timestamps and a request ID
Search by request ID to jump straight to a specific call, and export the current view to CSV. Click into a row for the full request/response detail.
Logs apply PII masking both in your browser (email/phone/card patterns) and on the server when org-level redaction is enabled — see Data Policy below.
Logging callbacks
Under Log Settings → Callbacks, configure external observability platforms as log destinations. Each callback can be set to fire on success only, failure only, or both:
| Destination | Typical use |
|---|---|
| Langfuse | LLM tracing and evals |
| Datadog | Metrics and APM |
| Amazon S3 / Google Cloud Storage | Long-term raw log archive |
| Slack | Push notable events to a channel |
| Athina | LLM monitoring and evaluation |
| OpenMeter | Usage metering |
| Custom Callback | POST logs to your own HTTP endpoint |
Each destination has its own credentials (for example, Langfuse needs its public/secret keys and host). Sensitive fields are masked in the UI with a show/hide toggle.
Beta — coming soon. You can add destinations and verify their credentials with Test connection today. Automatic streaming of your request logs to these services is not yet active; we'll enable delivery soon.
Data policy & PII masking
Your organization controls how much request metadata is retained and whether PII is redacted. Request/response content is never written to the log (a privacy-safe default): the log carries identity, shape, outcome and cost, and no prompt or completion text enters it. The logging level governs how much of that metadata is retained, and Full Logging (capturing request/response content for debugging) is coming soon. Configure logging level and PII masking in Privacy Settings. Cost headers (x-nr-request-cost) always pass through so spend stays accurate regardless of logging level.
The serving cache is a separate question — and you control it
The log is not the only place a response body can exist. Separately from logging, response caching is on by default, so a completed response can sit for a few minutes in a short-lived serving cache, keyed to your organization and team, so a byte-identical repeat request skips the provider call. That is a cache and not a record — not queryable, not exported, not part of your log, and gone on its own — but it is not nothing, so it is worth stating plainly rather than folding into "we don't store content".
Caching is on by default for identical non-streaming requests (streaming requests are never cached), and you control it at two levels:
- Switch caching off for the whole organization in Router Settings or under Settings → Privacy, so no request depends on a caller remembering a field.
- Or send
nrouter_cache: falsein the JSON request body and that call is neither answered from the cache nor written into it. Use it on the calls carrying content you would rather never sit in a cache, and leave caching on for the rest. - The response tells you which happened.
x-nr-response-cacheishit(served from the cache),miss(went to the provider), orbypass(the request was opted out, per call or by the organization toggle), so compliance with your opt-out is something you can observe, not something you have to trust. No header means the request was not eligible for the cache. - The cost of opting out is latency, not spend: a cache hit is metered and billed like any other request, so an opted-out request pays the full provider round trip and the same charge it would have paid as a hit.
Streaming requests never touch the response cache. The mechanics, including what makes up a cache key, are in Router Settings › Response caching.
Response headers — telemetry on the call itself
The request log is the aggregate view. Every individual response also carries its own telemetry in the x-nr-* namespace, so a client can record what happened without ever reading the dashboard. These are the customer-facing headers:
| Header | Value | Emitted |
|---|---|---|
x-nr-request-id | Unique identifier for this request | Always — the ID to quote in support and to search the log by |
x-nr-latency-ms | Milliseconds from edge arrival until the response headers are ready | Always. On a stream this is time-to-headers, not total generation time |
x-nr-model | The physical model that served the request | On success — how you audit what a router alias resolved to |
x-nr-request-cost | Exact cost in USD | When the model is priced; absent when unpriced, never 0 |
x-nr-cost-status | exact or unpriced | On every served response — including the unpriced ones, where it is the only thing that tells you the cost header is absent rather than zero |
x-nr-input-tokens / x-nr-output-tokens / x-nr-total-tokens | Token counts as the provider reported them | When usage is available |
x-nr-cache-read-tokens / x-nr-cache-write-tokens | Provider prompt-cache token counts | Only when non-zero |
x-nr-routing | direct, or fallback:<n> where n is the 0-based chain index of the entry that answered — the first fallback is fallback:1 | When a provider call answered. Absent on a cache hit and on a refusal |
x-nr-attempts | Provider calls this request made, retries and failovers alike (≥ 1) | Same as above — absent on cache hits and refusals |
x-nr-response-cache | hit, miss, or bypass | On cache-eligible requests |
x-nr-response-cache-age | Age of a cache hit, in seconds | On a hit |
x-nr-guardrails | none, monitor, pass, redacted, partial, blocked, or unavailable | On every wire that runs a pre-call guardrail chain. redacted means an enforcing rule rewrote part of the prompt before it went to the provider; partial means some content was not inspected |
x-nr-compression | applied, skipped, not_requested, or off | On requests where prompt compression was considered |
x-nr-funding-source | allowance or credits — which balance paid | On a billed request |
x-nr-budget-warning | <scope> soft_budget <spend>/<ceiling> | When a soft budget you configured was crossed by a request that still served |
x-nr-limit-source | Which ceiling refused: key, team, plan, budget, capacity, and related values | On 429 and 402 responses |
x-nr-allowance-reset | Seconds until the tightest usage-allowance window resets | When an allowance window applies |
x-nr-auth-reason | Machine-readable reason a virtual key was refused | On an authentication refusal |
x-nr-trace-id | The trace ID for this request | When a valid trace exists |
Absence is a fact, not a gap. A header that does not appear is saying that the thing it reports did not happen — x-nr-request-cost is absent rather than 0 when a model is unpriced, and x-nr-routing is absent rather than direct when no provider call answered. Never read a missing header as a zero or a default.
The three per-request body fields these headers report on — nrouter_fallbacks, nrouter_guardrails, and nrouter_cache — are documented in Per-Request Options.
Alert channels
Observability → Alerts → Channels defines where notifications go — Email, Slack, Microsoft Teams, Jira, or a generic Webhook. See also Alerts & Notifications.
Next steps
- Alerts & Notifications — Get notified on errors, slow calls, and budget thresholds
- Analytics & Reports — Aggregate the same data into spend and usage reports
- Guardrails — Correlate guardrail decisions with request logs by request ID
FAQ
What does each row in the request log show me?
The Logs page lists every request individually, with the model and provider, token counts and total cost, latency and status (success or error), cache-hit status, start/end timestamps, and a request ID. Click into any row to see the full request and response detail.
Can I look up a single request or export my logs?
Yes. Search by request ID to jump straight to a specific call, and use the CSV export to download the current filtered view. You can also filter by model, status, and time range before exporting.
Do I need to change my application code to get request logging?
No. Every request through nRouter is logged automatically — there's no SDK change, header, or flag to enable. Logs appear on the Logs page as soon as calls run.
Who can change the logging level and data policy?
Viewing logs is available to your whole organization, but changing the logging level (zero, metadata, full, or PII-redacted) is an owner/admin action — members see the Privacy Settings controls as read-only. This is a documented permission boundary, not a temporary limitation.
If I reduce logging or redact PII, will my spend numbers still be accurate?
Yes. The cost header (x-nr-request-cost) always passes through regardless of your logging level, so spend, budgets, and analytics stay accurate. Request/response content is never written to the log (a privacy-safe default); the logging level controls how much request metadata is retained, never billing.
Which external tools can I stream my logs to?
Under Log Settings → Callbacks you can configure Langfuse, Datadog, Amazon S3, Google Cloud Storage, Slack, Athina, OpenMeter, or your own HTTP endpoint via a Custom Callback as log destinations. Each has its own credentials, entered once and masked in the UI with a show/hide toggle. Adding destinations and verifying them with Test connection works now; automatic streaming of your request logs to these services is in Beta and coming soon.
Can I forward only failed requests to an external tool?
Yes. Each callback can be set to fire on success only, failure only, or both — so you can, for example, push only errors to a Slack channel while archiving everything to S3.
How is PII protected in my logs, and where do I control it?
Logs apply PII masking in two places: pattern-based masking (email, phone, card) in your browser, and server-side redaction when org-level redaction is enabled. You configure the logging level and PII masking in Privacy Settings.
What telemetry comes back on the response itself, without the dashboard?
Every response carries x-nr-* headers: x-nr-request-id and x-nr-latency-ms always, plus the model that served it, exact cost and cost status, token counts, guardrail posture, cache outcome, funding source, and — when a provider call answered — x-nr-routing and x-nr-attempts saying which chain entry answered and how many provider calls it took. The full table is above.
Why is a header I expected missing from a response?
Because the thing it reports did not happen. Absence is deliberate and load-bearing: x-nr-request-cost is absent rather than 0 when a model is unpriced, and x-nr-routing and x-nr-attempts are absent rather than reporting a placeholder on a cache hit or a refusal, where no chain entry answered a provider call. Do not treat a missing header as a default value.
What's the difference between a logging callback and an alert channel?
A logging callback is a destination for your request logs on an observability or storage platform (Langfuse, Datadog, S3, and so on) — you can configure destinations and verify them today, and automatic streaming is coming soon (Beta). An alert channel (Email, Slack, Microsoft Teams, Jira, or a generic Webhook) is where notifications go when an alert fires.
Who can set up logging callbacks and alert channels?
Creating or editing callbacks and alert channels is an admin/owner action; members can view the configuration but not change it. This keeps log-forwarding destinations and their credentials under your organization's administrators.
Is my prompt or completion content stored anywhere?
Not in the log. Request/response content is never written to the request log — it carries identity, shape, outcome and cost only. Separately, a completed response can sit for a few minutes in a short-lived serving cache, keyed to your organization and team, so a byte-identical repeat skips the provider call. That is a serving cache and not a record: not queryable, not exported, and it expires on its own. If you would rather a particular call never touch it, send nrouter_cache: false in the request body.
How do I stop a request from being cached?
Put "nrouter_cache": false in the JSON request body. That request is not answered from the cache and does not fill it, and the response comes back with x-nr-response-cache: bypass confirming it. It is a per-request control, so you can opt out the sensitive calls without turning caching off for everything else — and the trade is that every opted-out call pays full provider latency and full provider spend. Full details are in Router Settings › Response caching.
Analytics & Reports
Analyze LLM spend, token volume, model latency, and error trends with nRouter advanced analytics. Generate team-level reports to optimize inference costs.
Alerts & Notifications
Configure real-time alerts for error spikes, high latency, provider outages, budget limit alerts, hanging requests, and automated daily usage summaries.