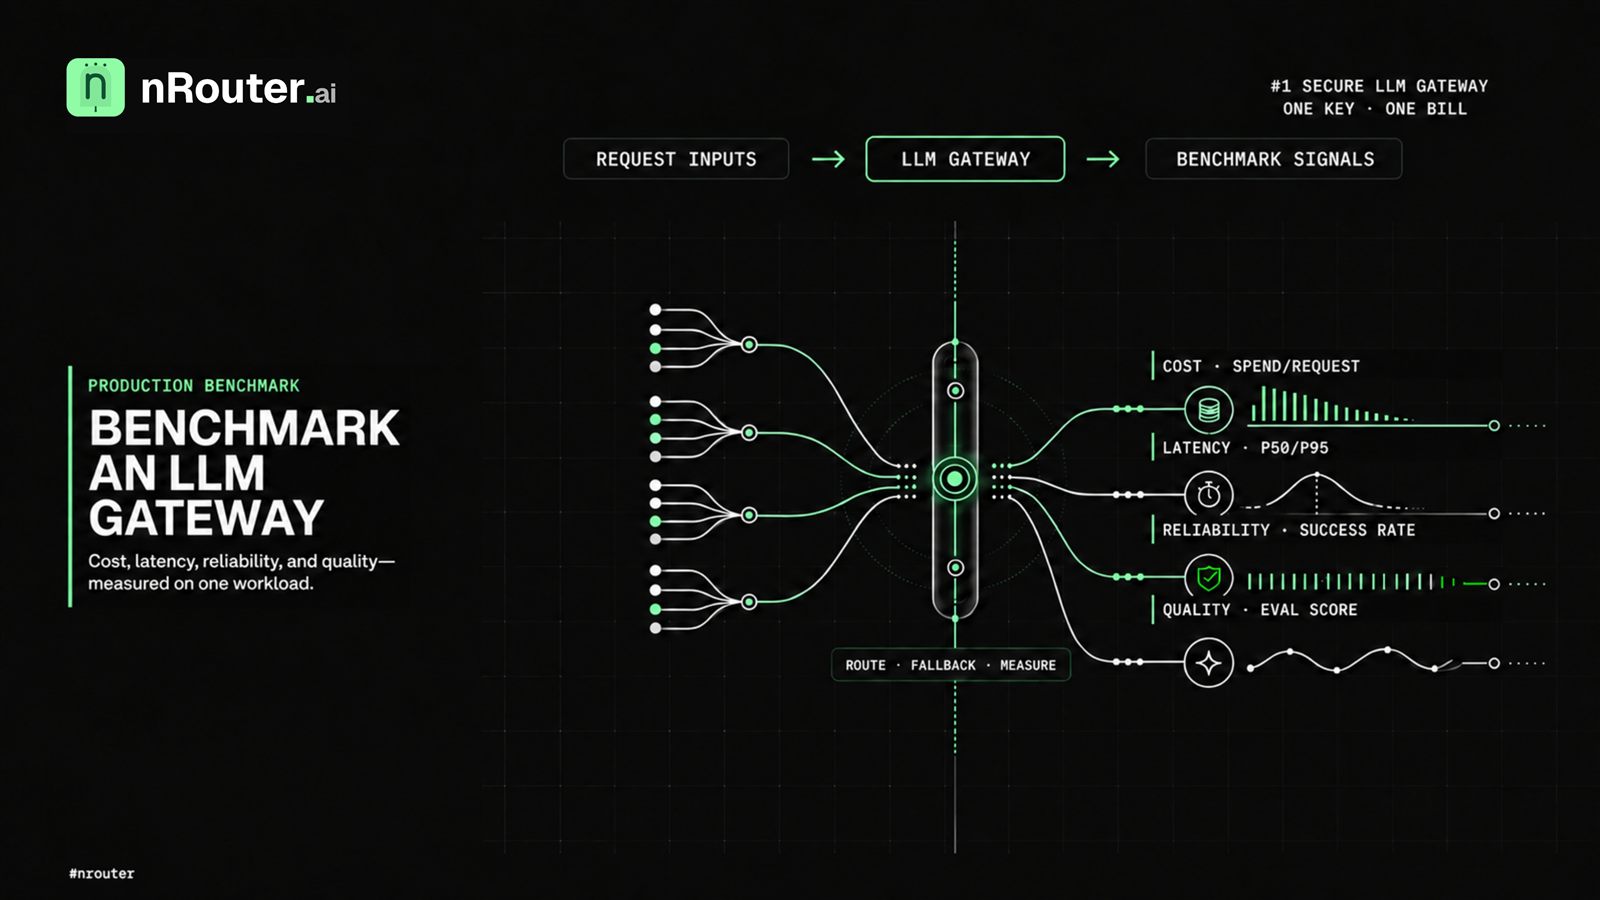
The answer: benchmark an LLM gateway with a fixed workload, a warm-up phase, repeated trials, and four separate scorecards: provider cost, end-to-end latency, failure recovery, and output quality. Do not compress them into one “best gateway” score. A gateway can be cheap but slow, fast but unreliable, or available but poor for your task.
If you are comparing an LLM gateway in a spreadsheet, the first question is not “which vendor has the most models?” It is “which system behaves best on the traffic we actually run?”
That distinction matters because gateways make different promises. OpenRouter documents model and provider routing, automatic fallback, and one endpoint across many providers. Vercel AI Gateway documents budgets, provider selection, monitoring, and fallback behaviour. Portkey publishes material on routing, observability, guardrails, prompts, and caching. Helicone approaches the problem from observability, evaluation, caching, and security. Those are useful capabilities, but feature lists are not a production benchmark.
This article gives you a repeatable method. The sample numbers are illustrative arithmetic, not nRouter performance claims. Replace them with measurements from your own workload.
The problem in one request
Consider one request from a customer-facing support assistant:
Input:  1,200-token support conversation plus account context
Output: a structured answer with a resolution code
Traffic: repeated across several model/provider routes
Success: valid JSON, correct resolution code, no prohibited data
The same request can produce four different outcomes:
| Outcome | What the user sees | What the platform owner sees |
|---|---|---|
| Cheap and correct | Fast, valid answer | Low cost and acceptable quality |
| Cheap and wrong | Fast but unusable answer | False saving and rework |
| Slow and correct | High wait time | Tail-latency problem |
| Failed and retried | Delay or duplicate work | Reliability and cost ambiguity |
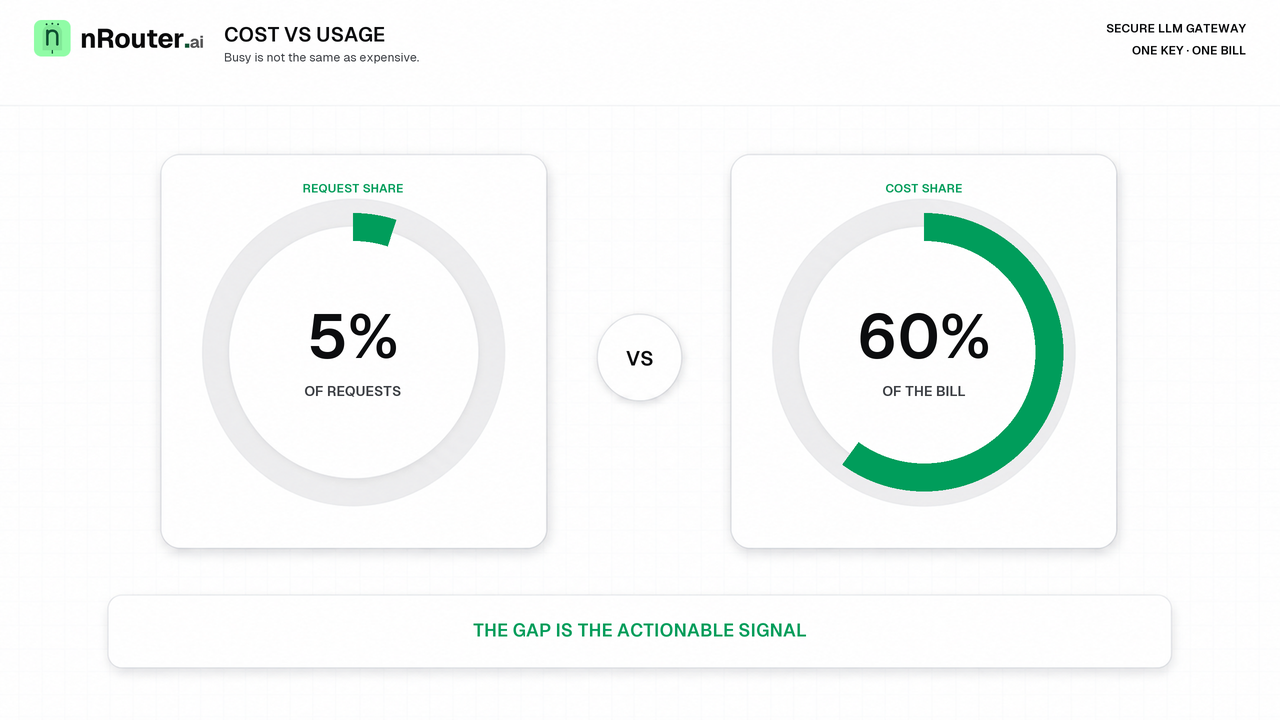
The mistake is to measure only the invoice. A benchmark that records token price but ignores invalid JSON, time to first token, or fallback success is measuring a rate card, not a production system.
Start by defining the request contract. Record the input shape, expected output schema, acceptable latency, quality rubric, and what counts as a failed attempt. The LLM request-log guide explains the fields worth capturing without storing more prompt content than you need.
Why the naive approach breaks
The common benchmark is a script that sends one prompt to one model and prints the average duration. It breaks in five predictable ways.
- One prompt is not a workload. A single easy prompt can hide long-context, tool-calling, refusal, and structured-output failures.
- Cold starts distort the first samples. Connection setup, DNS, TLS, and provider warm-up can make the first request unlike the next hundred.
- Averages hide the tail. If 95 requests are fast and 5 are painfully slow, the mean may look acceptable while real users wait.
- Retries blur the unit of measurement. Counting a request that succeeds on its third attempt as one success hides the latency and provider work behind it.
- Quality is treated as a feeling. “The answer looked good” is not a reproducible evaluation.
The benchmark needs a clear unit. Use a logical request for the user-visible operation and record every attempt beneath it. The logical request may have one attempt on a healthy route or several attempts when a provider fails.
That distinction also keeps cost honest. nRouter reports an authoritative request cost when it is known through x-nr-request-cost; when a call is unpriced, the header is absent rather than pretending the cost was zero. The accounting model is explained in One Authoritative Cost Per LLM Request and Reserve-and-Settle: Never Overspend a Credit Balance.
The mechanism: one workload, four scorecards
Run the same workload through every candidate. Keep the prompt set, request body, concurrency, timeout, retry policy, and success criteria constant. Change only the gateway or route under test.
The four scorecards are:
| Scorecard | Minimum measurements | Why it matters |
|---|---|---|
| Cost | Cost per logical request, cost per successful answer, unpriced share | A low unit rate is irrelevant if retries or rework dominate |
| Latency | Time to first byte/token, total latency, p50, p95, p99 | Users experience the tail, not the average |
| Reliability | HTTP failures, timeouts, fallback rate, final success rate | A response that arrives after three failed attempts is not a healthy path |
| Quality | Valid format, task correctness, refusal accuracy, safety checks | The cheapest answer is not useful if it fails the task |
Do not combine the four scores until the decision is explicit. If you need one ranking, publish the weights beside it. A team choosing a background summarizer may accept higher latency for lower cost. A checkout assistant may choose reliability and quality first.
Build the workload matrix
Use at least four classes of requests:
| Class | Example | Main risk |
|---|---|---|
| Normal | Typical production request | Represents the common path |
| Long context | Large retrieved context | Context limits and latency |
| Structured | JSON or tool arguments | Parser and schema failures |
| Adversarial | Ambiguous, unsafe, or injection-shaped input | Guardrail and refusal quality |
Keep a small golden set with expected properties, not necessarily one exact answer. For a classification task, the expected class can be exact. For a generated explanation, score factual support, required fields, and prohibited claims separately.
The deterministic A/B testing guide is useful when you want the same user or request class to stay on the same variant during a comparison. For routing by cost and quality, see Cost-vs-Quality LLM Routing, but do not use routing to hide the performance of an individual route during the benchmark.
Worked example: one benchmark window
The following is illustrative arithmetic for 1,000 logical requests. It is not a measurement of nRouter or any competitor.
workload              1,000 logical requests
warm-up               100 requests, excluded from scoring
scored requests       1,000 requests
concurrency           fixed for every candidate
quality pass valid schema + rubric score >= threshold| Candidate | Successful answers | p95 latency | Cost | Quality passes |
|---|---|---|---|---|
| Route A | 982 | 1,420 ms | $8.84 | 965 |
| Route B | 991 | 1,860 ms | $6.91 | 972 |
| Route C | 976 | 980 ms | $10.72 | 948 |
Cost per successful, quality-passing answer makes the tradeoff visible:
Route A: $8.84 / 965 = $0.00916
Route B: $6.91 / 972 = $0.00711
Route C: $10.72 / 948 = $0.01131
Route B is slower than Route C but produces the lowest cost per acceptable answer. Route C is fastest at p95, yet its lower quality-pass count means the apparent latency advantage may be paid back in retries, human review, or customer support.
Now add failure recovery. Suppose Route B had 27 provider failures. A gateway fallback served 18 of those requests successfully and 9 ended as failures:
fallback rate             27 / 1,000 = 2.7%
fallback recovery         18 / 27    = 66.7%
final success rate        991 / 1,000 = 99.1%
Report the failed attempt separately from the logical request. Otherwise the benchmark will say “991 successes” without showing that 18 users were saved by a second route and 9 were not.
If a candidate cannot expose authoritative cost for some requests, record those calls as unpriced and publish the unpriced share. Do not assign $0, because unknown is not free. The Cost Honesty post explains why this distinction matters when comparing providers.
Edge cases we had to decide
The benchmark is only useful if its decisions are written down before the run.
-
When a warm-up request is slow, we exclude it from the scored sample because connection and provider setup are not representative of the steady-state window. We still publish warm-up results separately so the cold-start cost is not hidden.
-
When a request times out, we count the logical request as failed until a later attempt returns a valid answer because a retry changes the user-visible experience. Record the timeout, retry, final status, and total wall-clock time.
-
When a fallback route returns a valid answer, we count one logical success and multiple attempts because the user received one answer but the system spent time recovering. This is why fallback rate and p95 latency must be separate columns.
-
When the output is syntactically valid but fails the task rubric, we count it as a quality failure because parsable output is not correct output. A JSON parser cannot tell you whether the resolution code is supported by the evidence.
-
When the provider returns a refusal or policy block, we score it against the test case rather than treating every refusal as an outage because safe refusal can be the correct result. The rubric must distinguish an appropriate refusal from an accidental one.
-
When the cost is unavailable, we mark the observation unpriced because assigning zero would bias the comparison toward the system with weaker accounting. The cost field stays missing, and the report shows the missing-data rate.
-
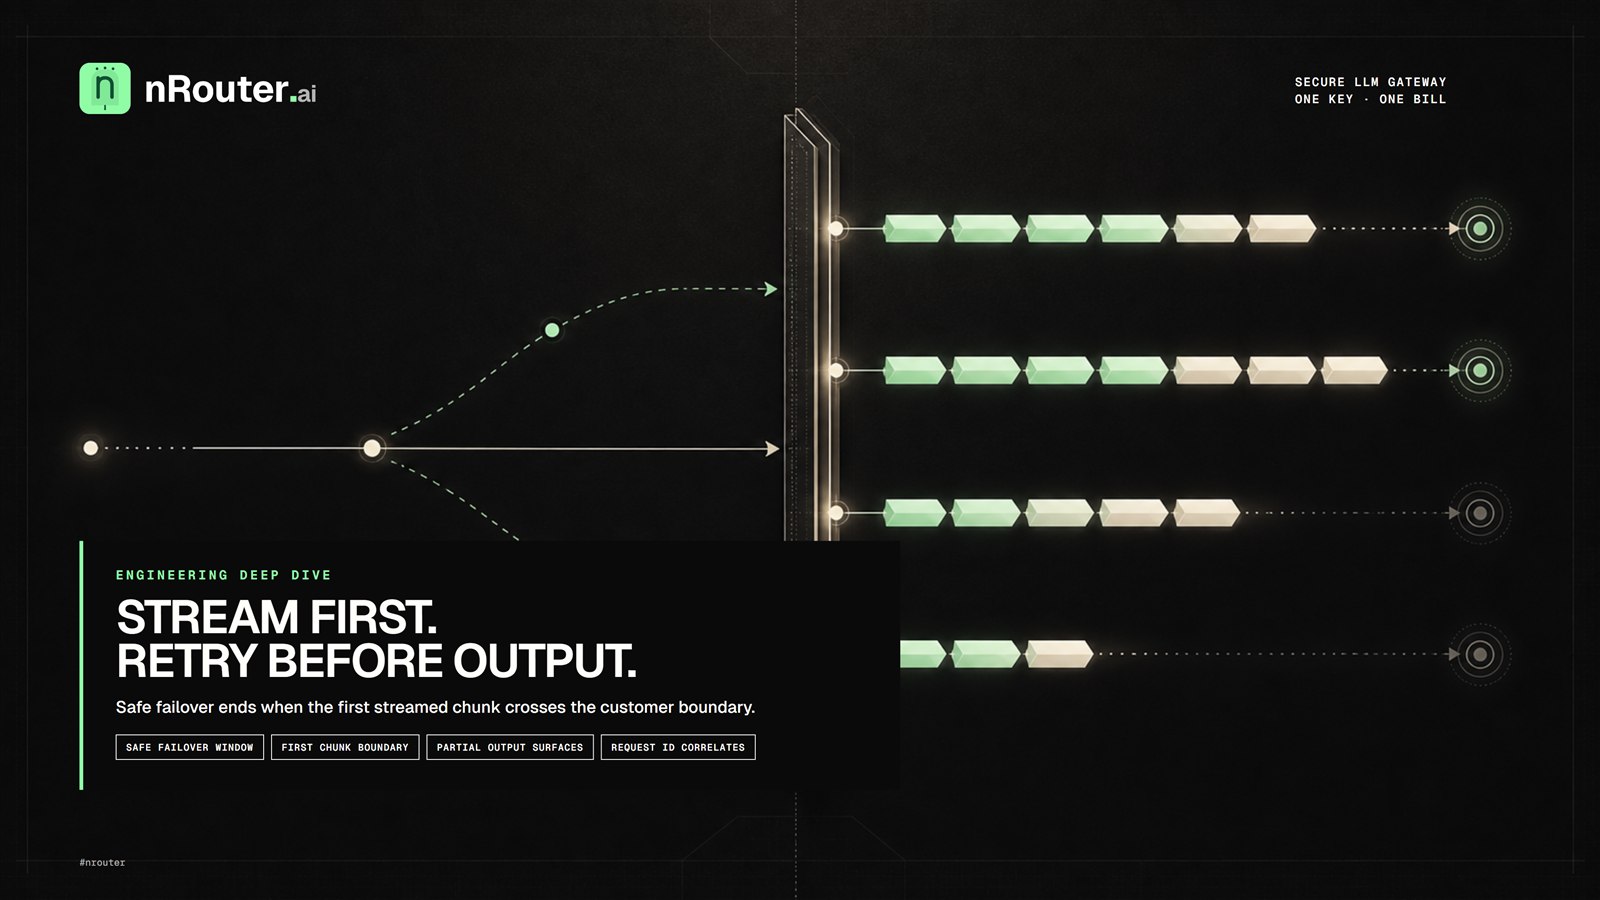
When streaming fails after output has started, we do not silently call the partial answer a success because the client received an incomplete response. Measure time to first token, bytes emitted, termination reason, and whether the application can safely retry. LLM Streaming Failures covers this boundary in detail.
What you see from the outside
A useful benchmark can be run from the client side. You do not need private provider dashboards to measure the user-visible contract.
Capture these fields for every logical request and attempt:
| Field | Example | Use |
|---|---|---|
| Logical request ID | bench-00042 | Joins retries into one user operation |
| Attempt number | 1, 2 | Shows recovery cost |
| Start and end time | UTC timestamps | Reconstructs total latency |
| HTTP status | 200, 429, 5xx | Separates failure classes |
| First-byte time | milliseconds | Measures perceived responsiveness |
| Total duration | milliseconds | Measures completion time |
| Cost | value or absent | Calculates cost without false zeros |
| Quality result | pass/fail plus rubric fields | Separates answer quality from transport success |
For nRouter, the customer-visible headers include x-nr-request-id, x-nr-request-cost when cost is known, and x-nr-latency-ms. The request ID is the join key for checking the credit ledger and the audit trail.
Here is a minimal client-side shape using the OpenAI-compatible endpoint. The model name comes from your live catalog rather than being hardcoded into the article:
import os
import time
import httpx

payload = {
    "model": os.environ["NROUTER_MODEL"],
    "messages": [{"role": "user", "content": os.environ["BENCHMARK_PROMPT"]}],
    "temperature": 0,
}

started = time.perf_counter()
response = httpx.post(
    "https://api.nrouter.ai/v1/chat/completions",
    headers={
        "Authorization": f"Bearer {os.environ['NROUTER_API_KEY']}",
        "Content-Type": "application/json",
    },
    json=payload,
    timeout=30,
)
elapsed_ms = round((time.perf_counter() - started) * 1000)

print({
    "status": response.status_code,
    "elapsed_ms": elapsed_ms,
    "request_id": response.headers.get("x-nr-request-id"),
    "request_cost": response.headers.get("x-nr-request-cost"),
    "gateway_latency_ms": response.headers.get("x-nr-latency-ms"),
})
Run the same client shape against each candidate, then store raw observations before calculating summaries. The raw rows are what let another engineer reproduce your p95, inspect outliers, and challenge a surprising result.
Limits
A benchmark answers a defined question. It does not prove that one gateway is best for every workload.
- Workload bias is unavoidable. A support benchmark does not predict coding-agent quality. Publish the prompt classes and scoring rubric.
- Provider conditions change. Price, availability, model versions, and routing policies move. Put a verification date on the report and rerun it.
- Synthetic traffic is cleaner than production traffic. It is useful for controlled comparisons but misses user diversity, burst patterns, and long-tail inputs.
- Gateway overhead is only one part of total latency. Measure from the application boundary, and separate gateway time from provider time when the surface exposes both.
- Quality scoring needs human judgment for some tasks. Automated checks are repeatable, but they can reward the wrong behaviour if the rubric is weak.
- Fallback changes the answer distribution. A recovered request may have been served by a different model or provider. Record the route that actually answered.
- A single run is not evidence. Repeat on different days and under more than one concurrency level before making a procurement or architecture decision.
The honest output is often a decision boundary, not a universal winner: Route A is the best fit when p95 matters, Route B when cost per acceptable answer matters, and Route C when a particular quality requirement dominates.
Frequently asked questions
What is an LLM gateway benchmark?
An LLM gateway benchmark is a controlled comparison of gateway behaviour using the same workload, measuring cost, latency, reliability, and output quality separately.
Which metrics matter most when benchmarking an LLM gateway?
Measure cost per successful answer, p50/p95/p99 latency, final success rate, fallback recovery, structured-output validity, and task-quality pass rate. The right weighting depends on the workload.
Should retries count as a success?
Count the logical request as successful only when the final answer meets the contract, but record every failed attempt separately. This preserves both user outcome and recovery cost.
How many requests are needed for an LLM benchmark?
Use enough representative requests to include normal, long-context, structured, and adversarial cases. A small golden set is useful for quality; larger repeated runs are needed for latency and reliability percentiles.
Can I benchmark an LLM gateway with production data?
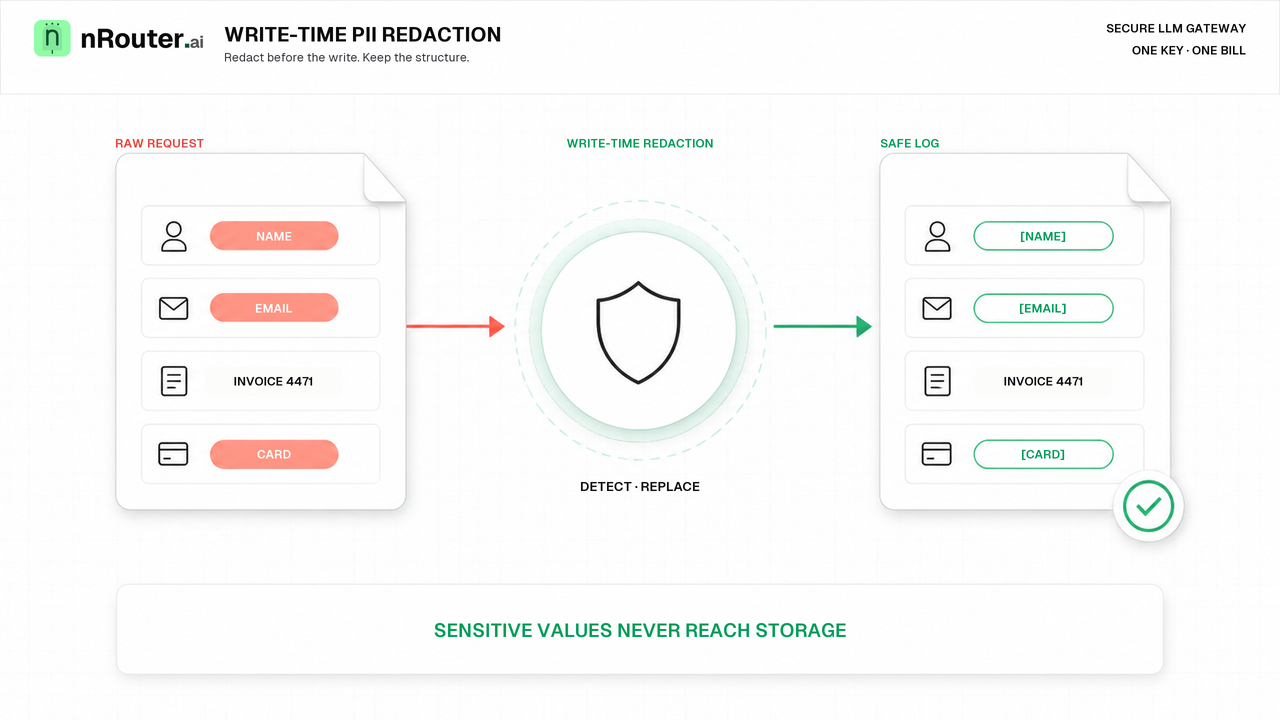
Yes, if you remove secrets and unnecessary personal data, define retention, and avoid sending sensitive content to an unapproved test route. Synthetic or redacted traffic is safer for the first comparison.
Try it
Create a small benchmark before you change production routing:
- Select 50–200 representative prompts and remove secrets and personal data.
- Split them into normal, long-context, structured-output, and adversarial cases.
- Define pass/fail rules before looking at results.
- Run a warm-up, then repeat each case at the same concurrency for every candidate.
- Store one row per attempt and one summary row per logical request.
- Report cost, p50, p95, p99, final success, fallback recovery, quality pass rate, and unpriced share.
- Rerun after model, provider, prompt, or gateway-routing changes.
Use the Models page to choose models available in your live catalog, Observability to inspect request behaviour, and Alerts to watch for regressions after the benchmark becomes a recurring test.
See also
- LLM Latency: p50, p95, p99, and Time-to-First-Token — how to interpret tail latency instead of relying on an average.
- Provider Fallback Chains: Surviving an OpenAI Outage — how to measure recovery without hiding failed attempts.
- Cost-vs-Quality LLM Routing: Which Tasks Can Go Cheap — how to turn benchmark results into routing rules.
- Hash-Based A/B Tests: Same User, Same Model Variant, Every Call — how to keep variants stable during an experiment.
- One Authoritative Cost Per LLM Request, Across Providers — how to reconcile cost across different provider routes.
- What an LLM Request Log Should Contain — and What to Leave Out — how to collect evidence without logging unnecessary content.
- Models — the current nRouter model and provider catalog for your environment.
Sources
Verified 2026-09-10. Competitor capabilities and terminology were checked against their public documentation and articles. The worked measurements in this draft are illustrative arithmetic, not vendor performance claims. Corrections to hello@nrouter.ai and we will update.
- OpenRouter model routing and fallback: openrouter.ai/blog/insights/model-routing
- OpenRouter reliability and failover: openrouter.ai/blog/insights/reliability-failover
- Portkey AI gateway management: portkey.ai/blog/ai-gateway-improves-the-management-of-ai-deployments
- Helicone LLM observability: helicone.ai/blog/implementing-llm-observability-with-helicone
- Vercel AI Gateway capabilities: vercel.com/docs/ai-gateway
- Vercel provider routing options: vercel.com/docs/ai-gateway/models-and-providers/provider-options
- nRouter observability documentation: nrouter.ai/docs/guides/observability