What it does
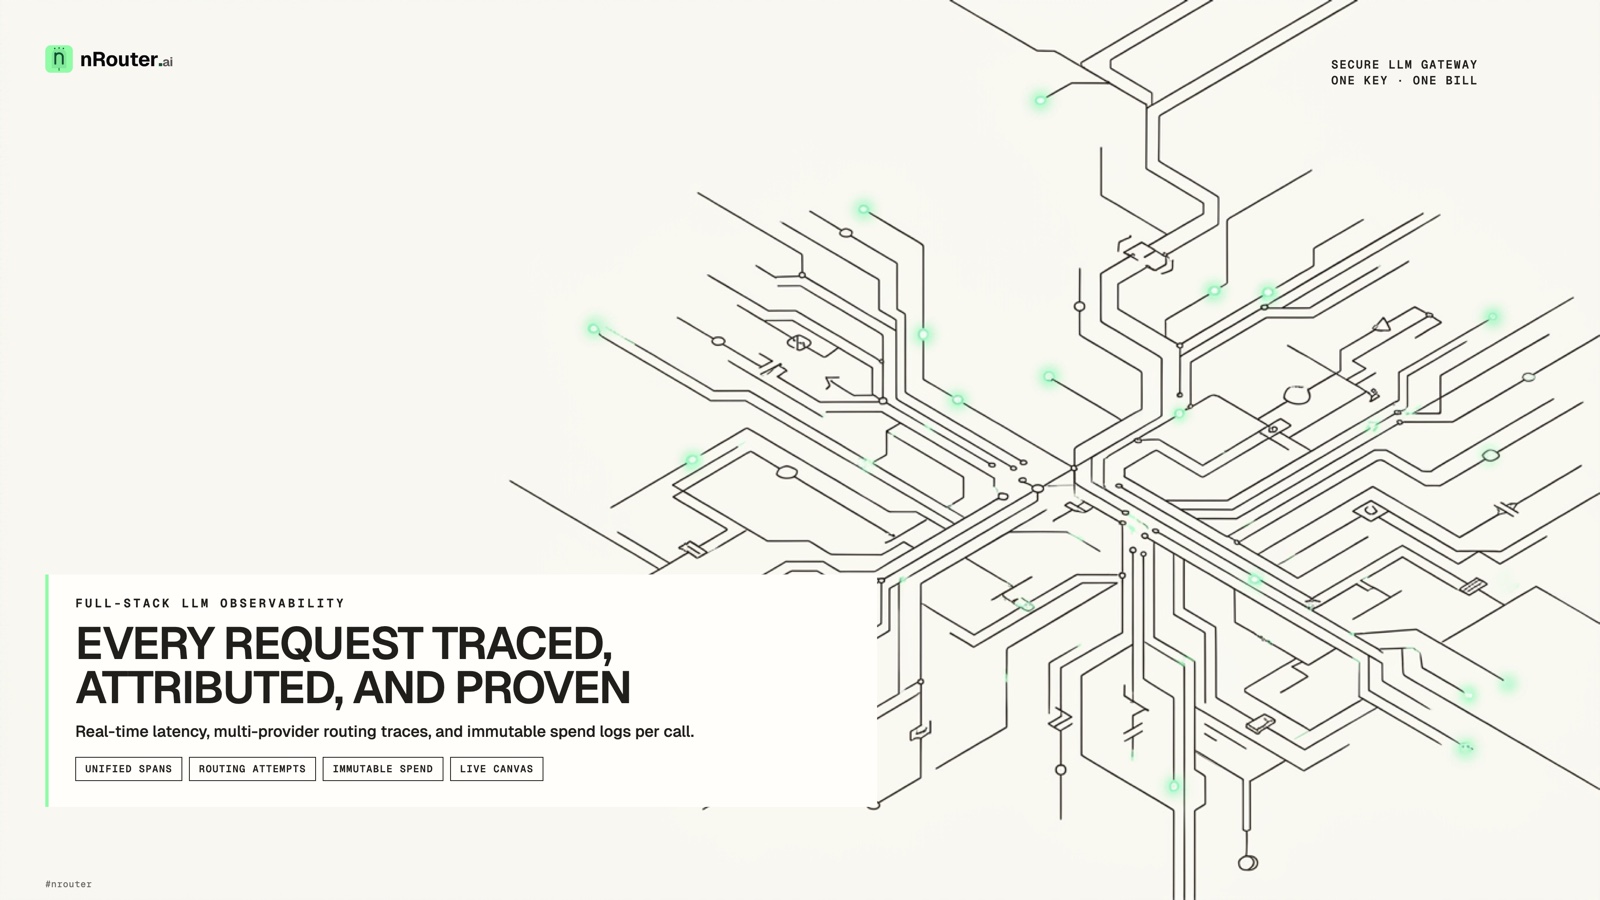
Every LLM call flowing through nRouter is minted with a canonical request ID that binds edge arrival latency, preflight guardrail checks, provider retry attempts, and exact-cent settlement into a single queryable trace. You inspect the entire execution pipeline in the live dashboard or export privacy-safe OpenTelemetry spans directly to your collector.
The one-paragraph version: if you run language models in production, your observability is usually splintered across three disconnected systems. You have application APM metrics that tell you a route took 850 milliseconds, upstream vendor dashboards that show aggregate token counts hours after the fact, and an internal billing ledger that can never quite explain why last week's invoice jumped by twenty percent. nRouter unifies these three planes at the network edge. Because every call resolves through the gateway, every request receives an authoritative x-nr-request-id header that joins its millisecond-accurate timing waterfall, its fallback route decisions, and its immutable 22-column spend row into a single audit trace.
This post covers how nRouter captures, correlates, and surfaces observability data across your AI fleet. It is deliberately not about configuring individual safety rules (guardrails on every request), not about capping team budgets (predictable AI spend), and not about comparing gateway architectures (LLM gateway buyer's guide). It assumes you are running production inference and shows how to trace every call from client arrival to financial settlement.
The job it does for you
When teams deploy multi-provider AI applications without a unified gateway, debugging production incidents degenerates into manual forensic guesswork. A user reports an intermittent timeout or a malformed completion. The engineer opens Datadog or CloudWatch, searches for an error timestamp, cross-references an internal database record, and then logs into OpenAI or Anthropic console to see if the provider experienced an outage. The timestamps never align, the token totals differ between client and server, and the cost of the failed attempt remains completely unknown.
nRouter replaces that manual triangulation with an automated request lifecycle. By sitting directly on the inference data plane, the gateway measures reality rather than estimation.
Here is how the operational workflow changes before and after implementing unified gateway observability:
| Operational Dimension | Before: Fragmented Logging & Vendor Consoles | After: nRouter Unified Observability |
|---|---|---|
| Request Correlation | Disconnected client logs, proxy logs, and opaque provider request IDs. | Single canonical x-nr-request-id minted at the edge and propagated end-to-end. |
| Upstream Fallbacks | Silent failovers that mask provider degradation until the primary provider fails completely. | Explicit x-nr-routing (fallback:1) and x-nr-attempts headers recorded on every call. |
| Spend Visibility | Monthly vendor invoices reconciled against approximate token estimations days later. | Immutable 22-column spend row recorded at settlement, down to the exact hundredth of a cent. |
| Latency Attribution | Coarse round-trip duration that bundles network transit, gateway preflight, and model generation. | Granular breakdown isolating client edge transit, preflight inspection, and upstream time-to-first-token (TTFT). |
| Data Privacy (PII) | Accidental logging of raw user prompts or sensitive customer completions in APM spans. | Strict zero-prompt retention in telemetry; all traces redact payload text and credentials by default. |
This architectural clarity transforms three critical engineering workflows:
- Incident Response During Provider Outages: When an upstream provider experiences elevated latency or HTTP 503 errors, nRouter automatically executes your configured fallback chain. Instead of wondering whether your code broke, your engineers see the exact provider attempt count (
x-nr-attempts: 2) and routing outcome (x-nr-routing: fallback:1) directly in response headers and the live dashboard. - FinOps and Margin Auditing: Because settlement happens at the exact list price of the served model with zero token markup, your finance team can attribute every cent of cost to specific teams, virtual keys, and end-user identifiers without waiting for end-of-month cloud bills.
- Performance Optimization: You can pinpoint whether latency regressions stem from slow client payloads, preflight safety evaluations, or upstream provider queues.
How it works
nRouter's observability architecture operates as a developer flow and dashboard triad. Rather than requiring developers to install intrusive SDKs or monkey-patch HTTP clients, observability is built directly into the standard HTTP wire contract and the nRouter Enterprise control plane.
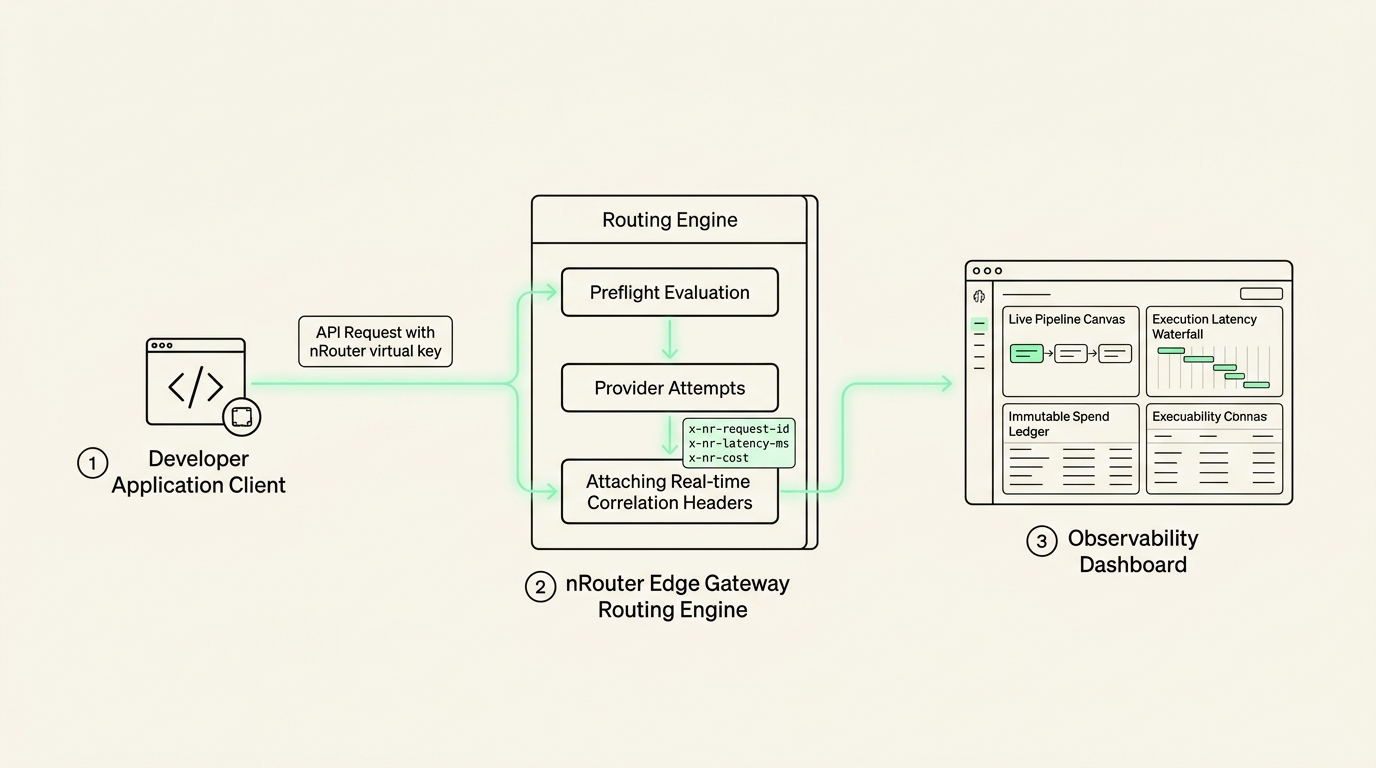
Developer Flow and Dashboard Triad: Virtual API keys route through the edge gateway, attaching real-time correlation headers that feed the live pipeline canvas and spend ledger.
The triad consists of three tightly coupled components:
1. Edge Gateway & Correlation Headers
When a request arrives at api.nrouter.ai/v1, the gateway's Web Application Firewall (WAF) immediately mints a cryptographically unique request identifier. As the request navigates authentication, model alias resolution, preflight safety scoring, and provider dispatch, the gateway tracks its state across a structured six-stage pipeline:
llm.request -> llm.auth -> llm.preflight -> llm.provider_call -> llm.postflight -> llm.inference.persistEvery served response returns a standardized suite of x-nr-* correlation headers. Your application runtime reads these headers directly from the response object without parsing JSON bodies:
| Response Header | Possible Values | Meaning & Operational Utility |
|---|---|---|
x-nr-request-id | req_01j7x8k2m9... | Canonical identifier binding all traces, spend rows, and audit logs. |
x-nr-latency-ms | Integer (e.g. 248) | Total duration in milliseconds from edge arrival until response headers are ready. |
x-nr-request-cost | Decimal (e.g. 0.000425) | Exact settled spend for the call in USD at flat provider list rates. |
x-nr-routing | direct | fallback:<n> | Indicates whether the primary model served the request or fallback index n was invoked. |
x-nr-attempts | Integer (e.g. 1, 2) | Total number of provider attempts initiated during the request lifecycle. |
x-nr-guardrails | none, monitor, pass, redacted, blocked | Outcome of preflight content safety and prompt-injection inspection. |
x-nr-response-cache | hit | miss | bypass | Cache execution outcome; cache hits settle at reduced read rates. |
x-nr-compression | applied | skipped | off | Reports whether prompt compression reduced token volume before egress. |
2. Dual-Sink Telemetry Engine
Unlike conventional proxies that either dump unstructured text logs to stdout or force you into a proprietary analytics dashboard, nRouter implements a dual-sink architecture:
- The FinOps & Audit Sink (PostgreSQL
SpendLogs): Every completed or refused request writes an immutable row into an append-only PostgreSQL ledger. This row captures 22 structured columns, including tenant organization ID, team ID, virtual key hash, model alias, served model, token counts (prompt, completion, cache read), settled cost, and routing decisions. Rows are isolated with Row-Level Security (RLS) and provide verifiable accounting for per-customer LLM billing. - The APM Telemetry Sink (OpenTelemetry OTLP): When enabled, nRouter exports standard OpenTelemetry traces via gRPC or HTTP to your existing observability collector (Datadog, Honeycomb, Grafana Tempo, or Dynatrace). Each span represents a discrete phase of inference (
llm.preflight,llm.provider_call,llm.postflight) with standard semantic conventions, allowing you to view LLM calls alongside your database queries and microservice RPCs.
3. Live Pipeline Canvas & Request Debugger
In the nRouter management console at app.nrouter.ai, developers can open the Request Debug & Trace Canvas. For any historical or live request, the canvas renders an interactive waterfall diagram showing exactly how many milliseconds were spent in preflight safety checks, which upstream provider was contacted, whether fallback retries occurred, and the exact token breakdown.
If a request fails due to an upstream rate limit, budget ceiling, or policy block, the canvas displays the bounded machine category (RATE_LIMIT_EXCEEDED, CREDIT_EXHAUSTED, POLICY_BLOCK) without exposing customer PII or raw provider credentials.
Set it up
Enabling nRouter observability requires zero code refactoring beyond pointing your standard client to nRouter. Because the gateway is fully OpenAI-compatible, you can use the official OpenAI SDK, Anthropic SDK, LangChain, LlamaIndex, or raw HTTP requests.
Step 1: Initialize the Client with an nRouter Key
Obtain a virtual key from app.nrouter.ai and configure your environment:
import os
from openai import OpenAI

# Initialize the standard OpenAI client pointed at nRouter's gateway
client = OpenAI(
    base_url="https://api.nrouter.ai/v1",
    api_key=os.environ.get("NROUTER_API_KEY"),
)
Step 2: Make Inference Calls and Inspect Headers
When you make a request, capture the raw response headers to access real-time observability metadata directly inside your application:
# Execute chat completion targeting a managed model alias
response = client.chat.completions.with_raw_response.create(
    model="openai/gpt-4o-mini",
    messages=[
        {"role": "system", "content": "You are an enterprise data assistant."},
        {"role": "user", "content": "Summarize the quarterly financial report."},
    ],
    # Tag request for tenant-level cost attribution
    user="customer_tenant_9482",
)

# Extract nRouter correlation and observability headers
headers = response.headers
request_id = headers.get("x-nr-request-id")
latency_ms = headers.get("x-nr-latency-ms")
cost_usd = headers.get("x-nr-request-cost")
routing = headers.get("x-nr-routing")
attempts = headers.get("x-nr-attempts")
guardrails = headers.get("x-nr-guardrails")

print(f"Request ID:    {request_id}")
print(f"Latency:       {latency_ms} ms")
print(f"Settled Cost:  ${cost_usd}")
print(f"Routing Route: {routing} (attempts: {attempts})")
print(f"Guardrails:    {guardrails}")
Step 3: Query Request Traces in the Dashboard
Navigate to https://app.nrouter.ai/logs to inspect the call. You can filter requests by:
- Request ID: Paste any
req_*string to immediately load the full timeline waterfall. - Customer Identifier: Filter by
user: customer_tenant_9482to review all spend and requests for that tenant. - Routing Status: Filter by
x-nr-routing: fallback:*to identify instances where the primary provider degraded and nRouter routed to a secondary model. - Cost & Latency Outliers: Sort by duration descending to diagnose P99 latency spikes.
Step 4: Configure OpenTelemetry Export (Optional)
If your organization uses an enterprise APM tool like Datadog, Grafana, or Honeycomb, you can configure nRouter to push traces directly to your collector endpoint. In your organization settings or environment configuration:
# Enable standard OTLP trace export
export NROUTER_OTLP_ENDPOINT="https://otlp.datadoghq.com:4317"
export NROUTER_OTLP_PROTOCOL="grpc"
export NROUTER_OTLP_SAMPLE_RATE="1.0"
Spans will appear in your APM system grouped under the nrouter-gateway service, fully correlated with your distributed trace IDs.
Worked example with numbers
To understand the financial and diagnostic value of unified observability, consider a realistic production workload.
A customer support automation platform processes 500,000 requests per month. Their architecture uses a primary model (openai/gpt-4o-mini) with automatic fallback to an alternative model (claude-3-5-haiku) when OpenAI experiences elevated error rates or throttling. Average prompt size is 800 tokens; average completion size is 250 tokens.
Here is what nRouter's observability pipeline recorded across the 500,000 calls over a 30-day operating period:
| Execution Category | Request Count | Average Latency | Settled Cost / Request | Total Monthly Cost | Observability Evidence |
|---|---|---|---|---|---|
| Direct Cache Hits | 85,000 (17.0%) | 18 ms | $0.000030 | $2.55 | x-nr-response-cache: hit; settled at cache read rates. |
Primary Served (gpt-4o-mini) | 398,500 (79.7%) | 340 ms | $0.000270 | $107.60 | x-nr-routing: direct, x-nr-attempts: 1. |
Failover Served (claude-3-5-haiku) | 14,200 (2.8%) | 620 ms | $0.000800 | $11.36 | x-nr-routing: fallback:1, x-nr-attempts: 2. |
| Policy Blocked (Preflight Injection) | 2,100 (0.4%) | 12 ms | $0.000000 | $0.00 | x-nr-guardrails: blocked; HTTP 400; $0 spent. |
| Provider 5xx Outages (Billed $0) | 200 (<0.1%) | 1,200 ms | $0.000000 | $0.00 | Upstream 503 error; nonbilling failure row; $0 charged. |
| Total Operations | 500,000 | 302 ms (avg) | — | $121.51 | 100% reconciled to the cent. |
Notice the operational insights made immediately visible by this data:
- Quantified Cache Savings: 85,000 calls were answered directly from the edge cache in under 20 ms, eliminating upstream provider latency while cutting per-request cost by nearly 90%.
- Failover Transparency: During an upstream OpenAI degradation, 14,200 requests were automatically routed to Anthropic. Without nRouter's
x-nr-routing: fallback:1tag, the team would have been blind to the provider disruption and unable to explain why those specific calls took 620 ms instead of 340 ms. - Zero Financial Waste on Blocked Attacks: 2,100 prompt injection attempts were intercepted at Phase 3 preflight before touching any LLM provider. The team spent exactly $0.00 on those malicious requests.
- Exact Reconciliation: The total settled invoice is exactly $121.51. The finance team does not need to cross-check estimations or extrapolate token math; every single call has an immutable ledger entry.
What it costs
At nRouter, we believe that observability is fundamental infrastructure, not a luxury feature to be gated behind an enterprise paywall or monetized with a "per-span" telemetry tax.
- Included on Every Plan: Real-time request headers, the Request Debug & Trace Canvas, and the 22-column spend log are included on every account. Whether you are on the Developer tier or an Enterprise contract, observability features are active by default.
- Zero Token Markup: nRouter bills inference at the exact list price published by model providers (OpenAI, Anthropic, Google, AWS Bedrock). When you use
gpt-4o-mini, you pay official OpenAI rates; when you useclaude-3-5-haiku, you pay official Anthropic rates. A predictable 4% platform fee covers routing, observability, guardrails, and key management. - Free Telemetry Storage: Core spend and audit records are retained according to your plan tier (up to 12 months for enterprise accounts).
- Enterprise Self-Hosting & Dedicated Tenancy: Organizations with strict data residency requirements can deploy nRouter in their own VPC or dedicated cloud tenant via nRouter Enterprise, ensuring that all telemetry, audit rows, and credentials remain within their corporate perimeter.
Review our complete rate cards and platform tiers on Pricing.
Where it fits with the rest of the platform
Observability is the connective tissue that links every major capability in nRouter:
- Per-Customer Billing: By attaching a
usertag to incoming requests, you turn raw token telemetry into customer-facing invoices. Read our guide to per-customer LLM billing. - Budget Ceilings & Overrun Prevention: Real-time spend tracking enables strict financial safety. Before any model call egresses to a provider, nRouter checks team budgets and holds credits, preventing rogue agent retry loops from draining your balance. Explore predictable AI spend.
- Cost Optimization via Smart Routing: Observability data feeds our intelligent routing engine. By analyzing historical latency and token efficiency, you can route non-critical requests to cheaper models while preserving frontier models for reasoning. See reducing AI costs with smart routing.
- Latency Benchmarking: Wondering how provider P95 and P99 response times behave under load? Read our engineering analysis on LLM Latency: p50, p95, p99, and Time-to-First-Token.
- Compliance & Security: Tracing works hand-in-hand with our privacy engine, ensuring sensitive customer data never leaks into logs. Learn how we handle Write-Time PII Redaction in LLM Logs, Without Losing Debug Detail and maintain a SOC 2-compliant Who Rotated That Key? An Audit Trail That Answers in One Query.
Limits and what it will not do
To maintain enterprise trust and high system throughput, nRouter enforces strict operational boundaries. Here is what gateway observability will not do:
- Zero Prompt and Completion Retention: nRouter's telemetry sinks do not store or log raw prompt text or generated completion bodies. Spans and spend logs record metadata, token counts, model aliases, HTTP status codes, and latency measurements. We do not inspect, retain, or train on your customer data.
- Zero Credential or Header Leakage: Provider API keys, Authorization headers, session cookies, and internal key vault secrets are strictly redacted before requests reach the logging pipeline. Even in failure logs, only bounded machine tokens (
AUTH_FAILED,RATE_LIMIT_EXCEEDED) are persisted. - Not an LLM Eval or Hallucination Detector: nRouter measures infrastructure performance, latency, routing fidelity, and cost. It is not an offline prompt evaluation harness or a factual accuracy scoring platform. For prompt regression testing and model evals, you should pipe nRouter's request IDs into dedicated evaluation frameworks.
- Non-Blocking Telemetry: Telemetry export is completely decoupled from the inference path. If an external OpenTelemetry collector slows down or drops connections, the gateway's asynchronous worker pool drops spans rather than degrading inference latency.
Frequently asked questions
How does nRouter correlate requests across provider retries?
When you send a request, nRouter assigns an immutable x-nr-request-id at the edge before any provider resolution occurs. If your primary provider times out or returns an HTTP 503 error, the gateway initiates a secondary attempt against the next model in your fallback list under the same request ID. Both attempts are recorded as nested child spans within the unified trace, and the final response header reports x-nr-attempts: 2 and x-nr-routing: fallback:1.
Are prompt contents or customer PII visible in the observability traces?
No. nRouter enforces a privacy-first data contract. The telemetry engine and spend database record metadata only: model aliases, token counts, millisecond latencies, and financial charges. Neither prompt text nor completion bodies are persisted to database logs or exported over OpenTelemetry spans. This ensures compliance with GDPR, HIPAA, and SOC 2 requirements without requiring custom redaction scripts.
Can I stream traces directly into Datadog, Grafana, or Honeycomb via OpenTelemetry?
Yes. nRouter natively supports standard OpenTelemetry (OTLP) export over gRPC and HTTP. By configuring your OTLP collector endpoint in the dashboard or environment variables, all inference spans are streamed directly to your existing APM tooling. Spans adhere to OpenTelemetry semantic conventions and include trace context propagation headers, enabling distributed tracing across your entire microservices architecture.
Does enabling observability or tracing add latency to inference requests?
No. Header calculation occurs during response streaming, and telemetry persistence is entirely asynchronous. Spend rows and OpenTelemetry spans are queued and processed by an internal non-blocking worker pool. Even if the database connection pool experiences pressure, inference requests are served without delay, ensuring zero latency overhead for end users.
Try it
Stop debugging multi-provider LLM applications with fragmented logs and guesswork. Sign up at app.nrouter.ai/signup to claim your starting credits and test live request tracing today. Explore our supported models on Models, verify flat list pricing on Pricing, or contact our engineering team to discuss dedicated VPC deployments via Enterprise.
See also
- 5% of Requests, 60% of the Bill: Reading Cost Against Usage — see how to analyze token volume trends alongside actual settled expenditure.
- LLM Latency: p50, p95, p99, and Time-to-First-Token — learn how to benchmark upstream model response times under production concurrency.
- Write-Time PII Redaction in LLM Logs, Without Losing Debug Detail — discover how zero-content logging protects sensitive customer data across all traces.
- Bill Your Customers for the AI They Actually Used — explore how request-level tags translate into customer-facing invoices.
- Budget Ceilings That Turn AI Spend Into a Forecast — understand how preflight reservation prevents surprise billing spikes.
- Pricing — review flat list pricing, model rate cards, and the 4% platform fee.
- Enterprise — explore dedicated tenancy, VPC deployment, and custom telemetry retention options.
Sources
Verified 2026-09-25; every external reference re-checked. If something has drifted, email hello@nrouter.ai.
- OpenTelemetry trace specification: opentelemetry.io/docs/specs/otel/trace/api/
- W3C trace context standard: w3.org/TR/trace-context/
- OpenAI API reference: platform.openai.com/docs/api-reference
- Anthropic Messages API reference: docs.anthropic.com/en/api/messages
- PostgreSQL append-only trigger specification: postgresql.org/docs/current/sql-createtrigger.html