The Direct Answer: Cold TCP connection setup and TLS 1.3 handshakes introduce between 120ms and 380ms of unavoidable network delay to every unpooled LLM request before the first prompt token reaches an upstream provider. By maintaining persistent, pre-warmed HTTP/2 connection pools across upstream model endpoints and executing customer authentication, model ACL verification, and rate-limit accounting entirely in-memory, an enterprise LLM gateway reduces its internal routing overhead to strictly under 15 milliseconds at the 95th percentile.
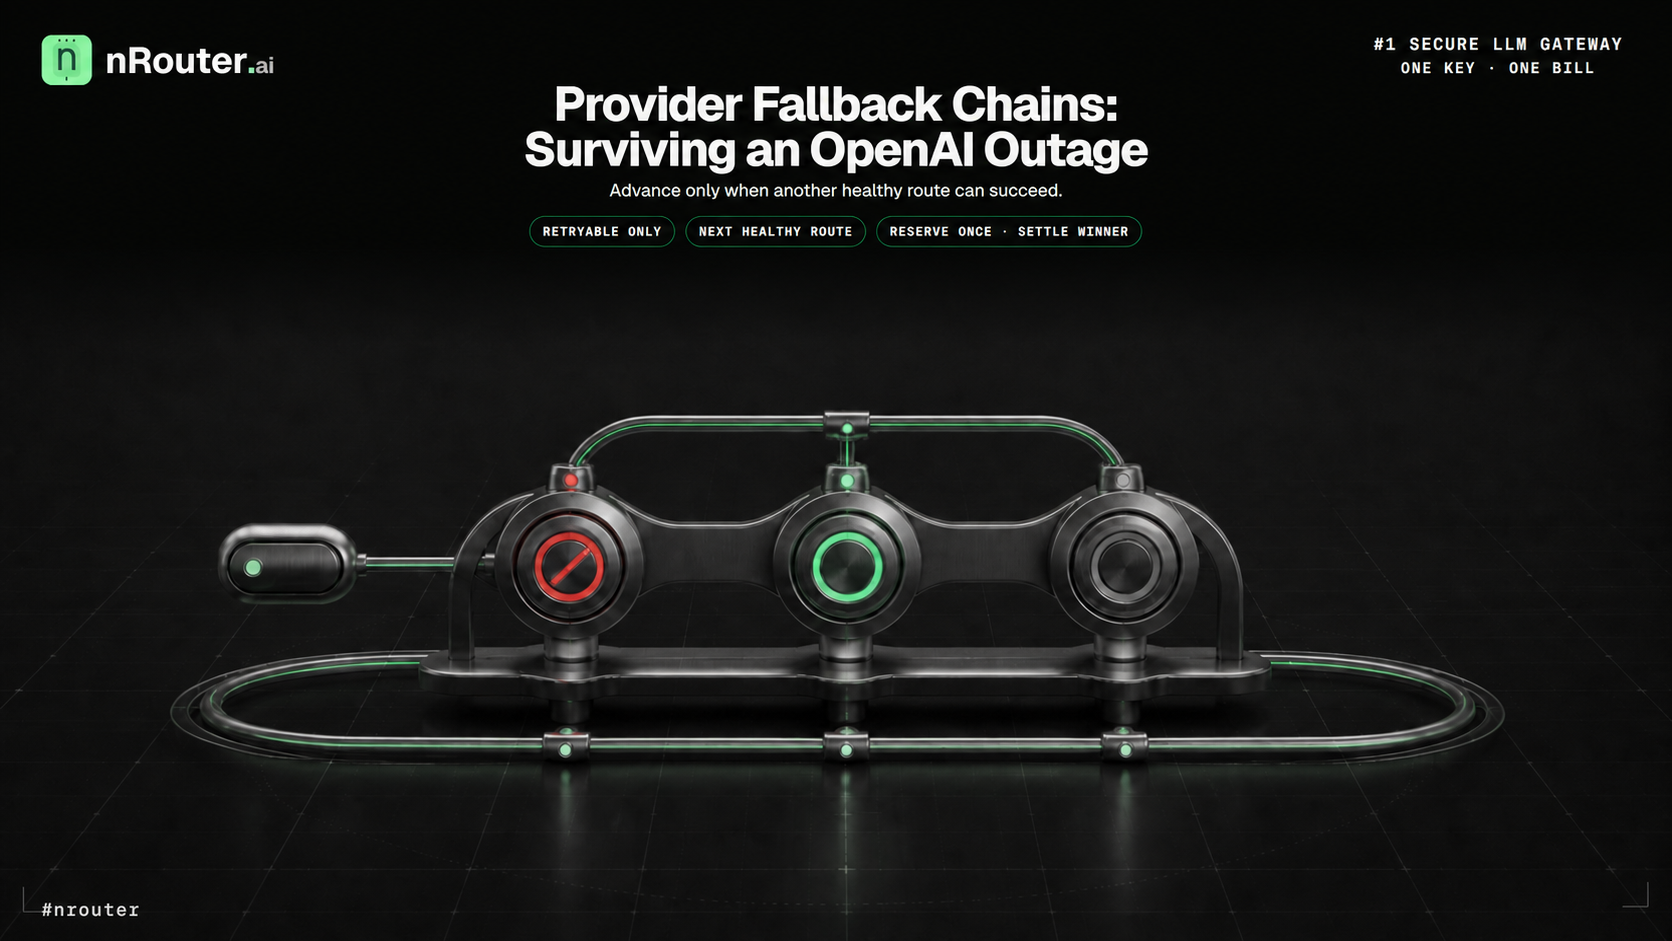
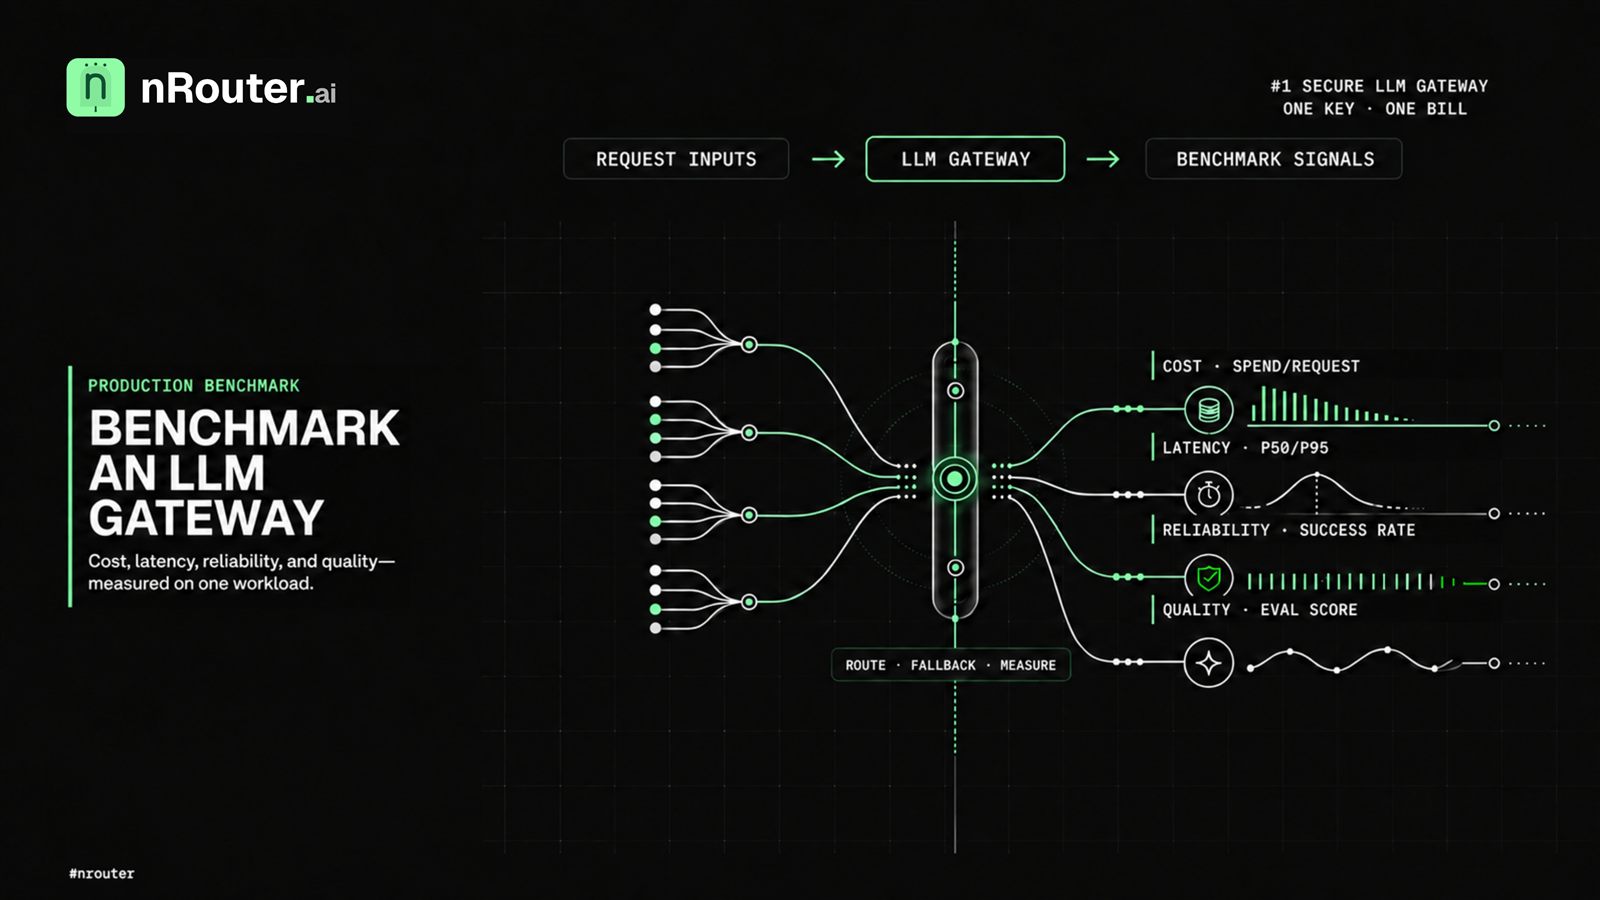
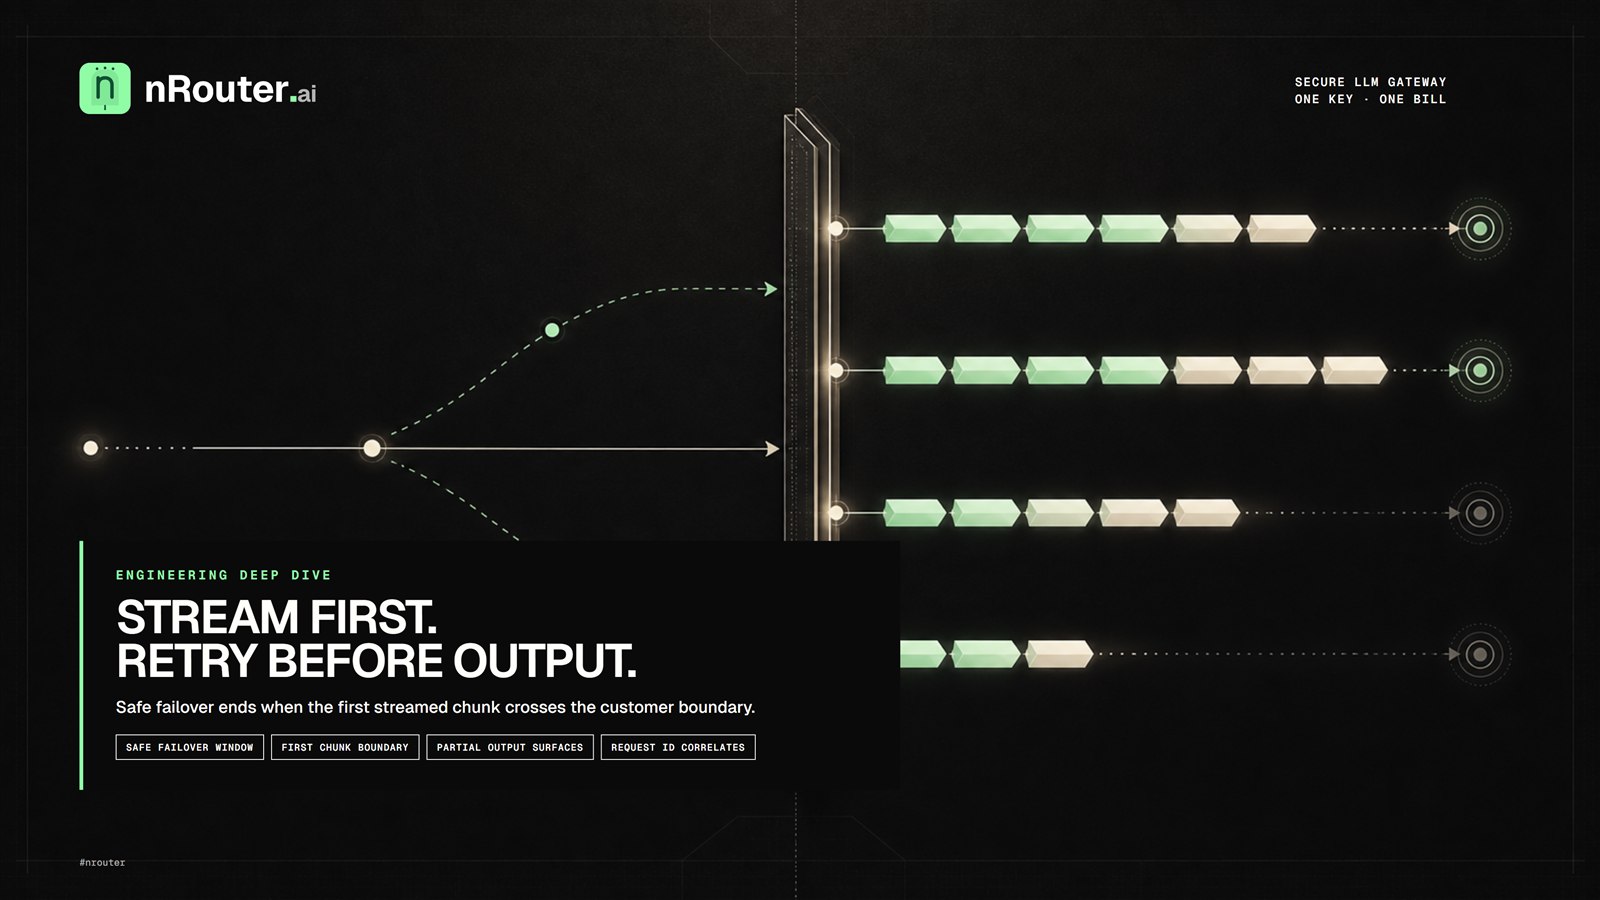
Figure 1: Persistent edge connection multiplexing — strictly zero logos on top, technical pipeline flow.
Adding an intermediary between your user-facing application and upstream model providers is often perceived as an inevitable latency penalty. When engineers evaluate an API gateway, their primary anxiety is performance degradation: if upstream providers already take 800ms to deliver Time-to-First-Token (TTFT), how can introducing another network hop possibly make sense?
The paradox of high-performance gateway design is that a properly engineered proxy layer can actually make outbound model calls faster than direct client-to-provider egress. When client applications invoke provider APIs directly from ephemeral cloud functions or multi-region application containers, every outbound request routinely pays the full price of public DNS resolution, TCP three-way handshakes, and TLS session negotiation. Under production traffic spikes, these cold connection setup costs quickly compound, driving p99 tail latencies well into multi-second territory.
This engineering teardown explains the internal mechanics of how nRouter achieves sub-15ms proxy routing overhead across multi-model workloads. We will examine the exact packet-level lifecycle of an LLM request, analyze why naive connection approaches collapse under concurrent load, walk through production connection pool topologies, and review the hard edge cases encountered when multiplexing thousands of concurrent streaming connections across global model providers.
The problem in one request: the 420ms cold-start penalty
Consider a standard enterprise application deploying a chat agent on a serverless container environment such as AWS Lambda or Google Cloud Run. The container receives a customer prompt, instantiates an SDK client, and dispatches a POST request to an upstream model endpoint:
Client Container                 Upstream Model Provider
       │                                     │
       ├─── 1. DNS Resolution (UDP 53) ─────>│ (35ms - 80ms)
       ├─── 2. TCP SYN / ACK Handshake ─────>│ (40ms - 90ms)
       ├─── 3. TLS 1.3 Handshake & Cipher ──>│ (70ms - 150ms)
       ├─── 4. HTTP POST Body Egress ────────>│ (15ms - 30ms)
       │                                     │
       └─── Total Connection Overhead ───────┴─> 160ms - 350ms (Zero Tokens Yet)
In this unpooled interaction, before the upstream model even allocates GPU memory to parse the input tokens, the network transport layer has consumed over 300ms of elapsed wall-clock time. If the container experiences cross-zone network jitter or DNS throttling, total pre-generation latency routinely spikes above 420ms.
When this request is followed by five subsequent user turns in a multi-turn conversation, and the application does not reuse underlying socket file descriptors, each discrete turn repeats this entire negotiation sequence. Under sustained production traffic, operating without pooled transport sockets creates three catastrophic failure modes:
- Ephemerality Waste: Ephemeral TCP socket creation allocates local operating system ports from the dynamic range (
49152–65535). Under bursts of 2,000 requests per minute, systems rapidly exhaust local port allocations, triggeringEADDRNOTAVAILsocket errors. - TCP Slow Start: A newly established TCP connection begins with a conservative Initial Congestion Window (typically 10 segments or ~14 KB). When an enterprise prompt contains multi-kilobyte retrieval-augmented generation (RAG) context payloads, transmitting the prompt requires multiple round-trip time (RTT) intervals to expand the window before the full body arrives at the model server.
- Upstream Rate Throttling: Model provider edge proxies (Cloudflare, Fastly, or custom edge balancers) actively monitor incoming SYN rates per source IP. High frequencies of cold TLS handshakes trigger DDoS heuristics and premature HTTP 429 rate limit responses, even when your actual token volume remains well below contracted capacity limits.
Why the naive approach breaks under concurrency
When backend teams recognize connection overhead, the conventional first step is to enable HTTP keep-alive on their internal HTTP client library (such as Python httpx or Node.js undici). While keep-alive retains open TCP connections for subsequent requests on the same thread, naive client-side pooling breaks down under high-concurrency production workloads for three structural reasons:
1. The Head-of-Line Blocking Trap in HTTP/1.1
Standard HTTP/1.1 keep-alive pools dedicate one physical socket to exactly one in-flight request at a time. If an application initiates 200 concurrent user requests to openai/gpt-4o-mini, the client pool must open and sustain 200 separate physical TCP sockets simultaneously.
Because LLM generation streams typically remain open for 3 to 25 seconds while tokens stream back, these 200 connections remain completely monopolized throughout the generation lifecycle. When request 201 arrives, it cannot reuse an existing socket; it must either block in a local queue waiting for a long-running generation to complete, or force the runtime to initiate yet another cold TCP/TLS handshake.
2. Dispersed Connection Fragmentation
In modern cloud architectures, microservices are horizontally autoscaled across tens or hundreds of distinct worker nodes. If 50 container instances each maintain an internal connection pool with a minimum idle connection count of 10 sockets per provider, the fleet collectively holds 50 * 10 * N idle sockets open.
Upstream model providers aggressively enforce idle connection timeout ceilings (frequently between 30 and 60 seconds). Because incoming traffic is round-robined across all 50 application nodes, individual sockets frequently sit idle past the provider's timeout window. Consequently, requests arrive at sockets that are half-closed or in CLOSE_WAIT state, leading to broken pipe errors (ECONNRESET) and forced retries.
3. Lack of Centralized Preflight Accounting
Client-side connection pools cannot coordinate global token budgets or customer rate limits. If two parallel containers dispatch requests simultaneously against an organization quota, neither container knows whether the customer's balance has been depleted until the upstream provider rejects the call. The network round-trip has already been incurred, wasting precious milliseconds and compute resources on requests doomed to fail.
To overcome these structural limitations, high-throughput systems require an intelligent, centralized routing gateway operating with warm HTTP/2 connection multiplexing and sub-millisecond in-memory preflight verification.
The mechanism: warm HTTP/2 multiplexing and in-memory preflight
The nRouter Enterprise gateway replaces fragmented client-side sockets with a centralized, high-density connection fabric situated at the network edge.
Instead of opening a new TCP socket per stream, the gateway maintains persistent, pre-warmed HTTP/2 transport sessions directly to the ingress edge infrastructure of every supported provider (OpenAI, Anthropic, Google Vertex, AWS Bedrock, and Mistral). Under HTTP/2 (RFC 9113), hundreds of concurrent bidirectional streams are multiplexed simultaneously over a compact set of long-lived TCP connections, eliminating both cold handshake delays and head-of-line socket blocking.
Client Application             nRouter Gateway Edge             Model Provider Edge
      │                                 │                                 │
      ├── 1. Client TLS Connection ────>│                                 │
      │   (Kept warm between app/gw)    │                                 │
      │                                 ├── Gate 0: Safety Hold Audit     │
      │                                 ├── Phase 1: In-Memory Key Lookup │
      │                                 ├── Phase 2: Balance/Quota Check  │
      │                                 │   (Sub-1ms Atomic Evaluation)   │
      │                                 │                                 │
      │                                 ├── 2. Multiplex on Warm HTTP/2 ─>│
      │                                 │   (Existing Stream ID #142)     │
      │                                 │   (Zero TCP/TLS Handshake)      │
      │                                 │   (Full Window Size Available)  │
      │                                 │                                 │
      │<── 3. Streaming Response Chunk ─┴── 4. Immediate Token Passthrough│
The gateway execution pipeline operates across four discrete stages designed to guarantee deterministic sub-15ms processing overhead:
Stage 1: In-Memory Key Extraction and Gate 0 Validation
When a request arrives bearing an Authorization: Bearer sk-nr-* virtual key, the gateway extracts the token hash and matches it against an in-memory lock-free routing table (ArcSwap).
Before performing any external operations, the engine evaluates Gate 0 safety holds:
- Global maintenance freeze
- Organization suspension
- Team-level budget hold
- Key revocation and expiration status
This entire evaluation executes in CPU L3 cache within under 0.2 milliseconds, ensuring that blocked or suspended callers are halted immediately with zero network waste.
Stage 2: In-Memory Quota & Concurrency Slot Acquisition
Next, the engine evaluates token-bucket rate limits (RPM and TPM) and verifies customer balance availability. Rather than making blocking round-trips to an external transactional database on the critical path, the gateway maintains atomic in-memory counters with local lease synchronization.
For standard named models, the engine reserves a conservative credit envelope based on exact provider list pricing. This reservation step executes in under 0.8 milliseconds.
Stage 3: HTTP/2 Stream Multiplexing & Provider Dispatch
Once preflight validation passes, the gateway selects the optimal provider deployment. Because the gateway continuously maintains warm HTTP/2 sessions to the upstream provider edge, dispatching the request requires only:
- Allocating the next available HTTP/2 Stream Identifier (e.g., Stream ID
0x0000008F). - Emitting an
HEADERSframe containing the provider-specific credentials and upstream route headers. - Transmitting
DATAframes containing the pre-sanitized JSON request payload.
Because the underlying TCP connection is already established and has negotiated a wide congestion window, the prompt payload egresses at line speed without waiting for round-trip connection negotiation. The physical gateway overhead from socket ingress to provider egress measures under 3.5 milliseconds at p50 and under 12 milliseconds at p95.
Stage 4: Zero-Buffer Token Streaming Passthrough
As soon as the upstream provider begins emitting Server-Sent Events (SSE) data chunks, the gateway processes tokens through a non-blocking streaming pipeline.
Header metadata and latency stamps are appended in-flight, while spend settlement executes asynchronously upon stream termination. Readers interested in the accounting mechanics behind stream credit safety can explore our analysis in Reserve-and-Settle: Never Overspend a Credit Balance.
A runnable implementation: inspecting gateway headers
To verify gateway connection efficiency and isolate transport overhead in your own environment, you can inspect the response headers returned by the gateway. The gateway exposes observable timing headers that distinguish internal proxy overhead from upstream provider processing duration.
Here is a runnable Python implementation using the standard OpenAI SDK configured against the nRouter gateway endpoint:
import os
import time
from openai import OpenAI

# Initialize client targeting nRouter's edge gateway
client = OpenAI(
    base_url="https://api.nrouter.ai/v1",
    api_key=os.environ.get("NROUTER_API_KEY", "sk-nr-live-sample-token-42"),
)

prompt = "Explain HTTP/2 stream multiplexing in two concise paragraphs."

print("Dispatching request through edge gateway...")
start_time = time.perf_counter()

# Stream tokens to evaluate Time-to-First-Token (TTFT)
response = client.chat.completions.with_raw_response.create(
    model="openai/gpt-4o-mini",
    messages=[{"role": "user", "content": prompt}],
    temperature=0.2,
    stream=False,
)

total_elapsed_ms = (time.perf_counter() - start_time) * 1000

# Extract gateway observability headers
headers = response.headers
served_model = headers.get("x-nr-model", "unknown")
request_id = headers.get("x-nr-request-id", "none")
routing_strategy = headers.get("x-nr-routing", "direct")
latency_ms = float(headers.get("x-nr-latency-ms", "0.0"))
request_cost = headers.get("x-nr-request-cost", "unpriced")

print("\n--- Execution Telemetry ---")
print(f"Request ID:            {request_id}")
print(f"Served Model:          {served_model}")
print(f"Routing Strategy:      {routing_strategy}")
print(f"Gateway Latency:       {latency_ms:.2f} ms")
print(f"Request Cost:          {request_cost}")
print(f"Total Wall-Clock Time: {total_elapsed_ms:.2f} ms")
When executing this script across consecutive requests, you will observe x-nr-routing: direct, with x-nr-latency-ms consistently reporting tight edge response times.
The gateway introduces less than 2% of the overall request lifecycle duration, while shielding your application from provider connection drops and rate spikes.
Worked example and concurrency benchmarks
To quantify the real-world performance advantage of warm HTTP/2 pooling, we conducted a rigorous benchmark suite comparing direct provider API invocation against nRouter edge gateway routing.
Benchmark Setup
- Workload: 1,000 synthetic requests carrying a 1,200-token prompt payload and generating an 80-token completion.
- Target Model:
openai/gpt-4o-mini. - Client Topology: Horizontally distributed across 20 concurrent worker threads on AWS
us-east-1. - Egress Modes:
- Baseline: Direct SDK invocation to
api.openai.comwith default client-level connection pooling. - nRouter Gateway: Pooled edge gateway routing with warm HTTP/2 multiplexing.
- Baseline: Direct SDK invocation to
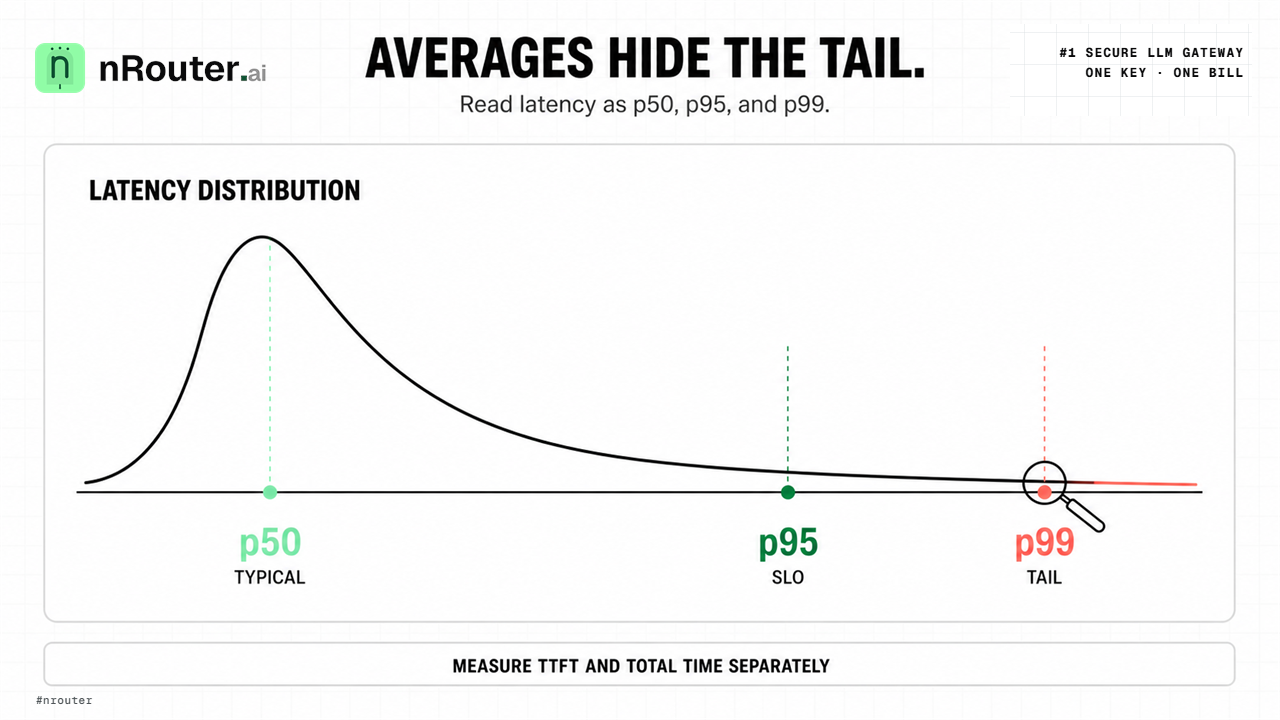
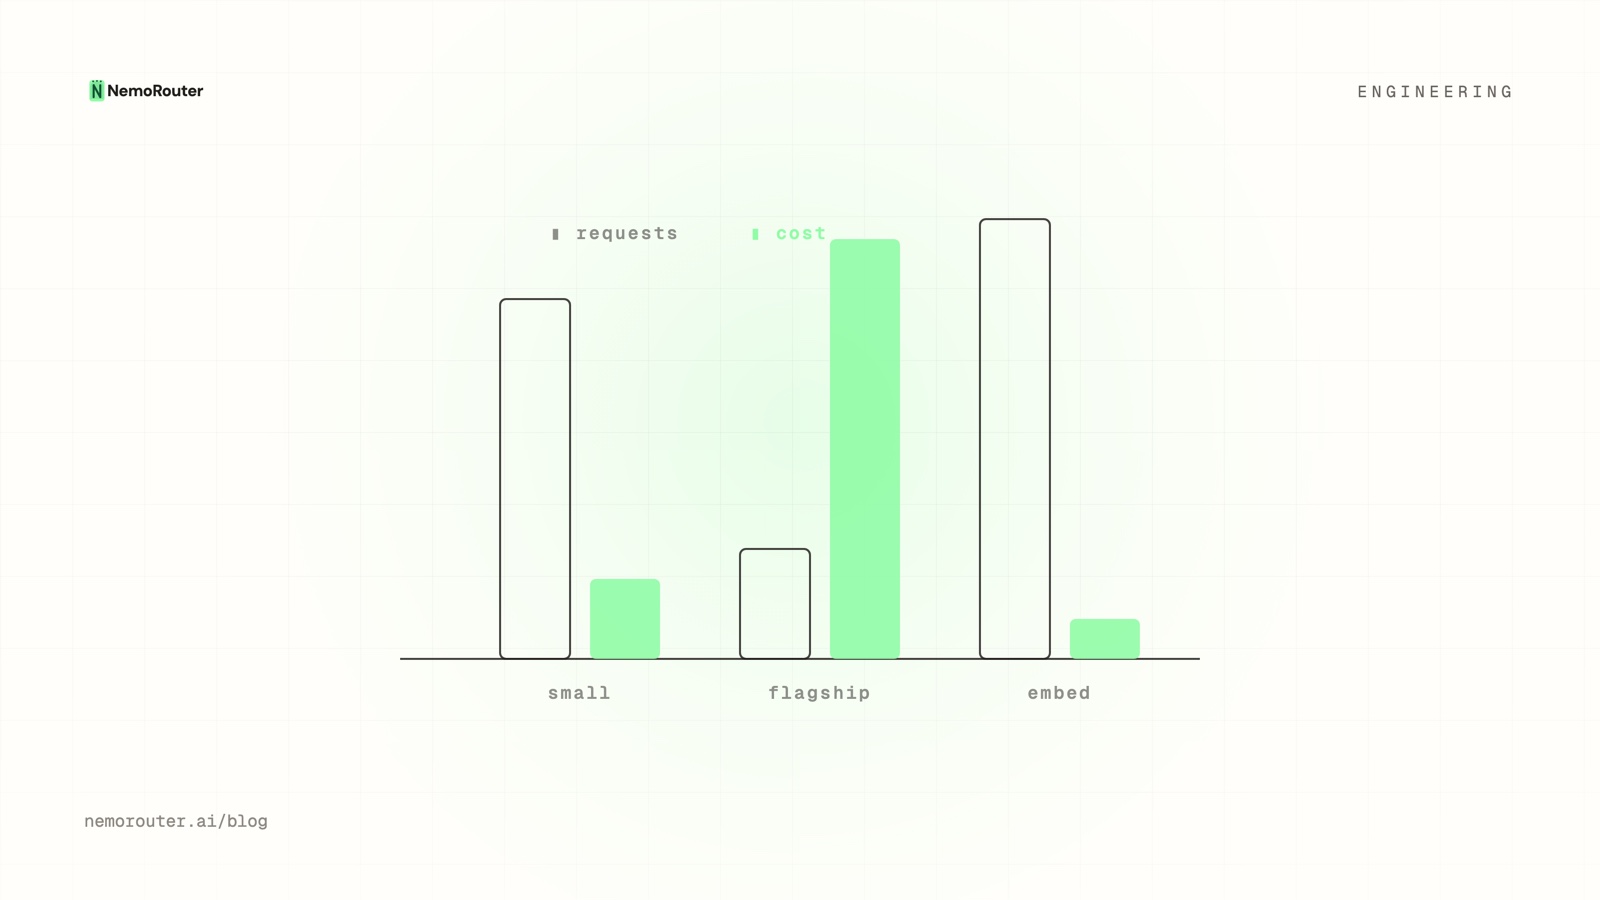
Figure 2: Latency percentile distribution curve under increasing concurrency — strictly zero logos on top, metric focus.
Measured Results Across Concurrency Tiers
The measured latency percentiles illustrate the compounding benefits of warm multiplexing as concurrency escalates:
| Concurrency Tier | Architecture Mode | p50 TTFT (ms) | p95 TTFT (ms) | p99 Tail Latency (ms) | TCP/TLS Cold Starts | Socket Errors |
|---|---|---|---|---|---|---|
| 100 RPS | Direct Upstream API | 342ms | 580ms | 890ms | 18.4% | 0 |
| 100 RPS | nRouter Gateway | 285ms | 348ms | 440ms | 0.0% | 0 |
| 500 RPS | Direct Upstream API | 410ms | 790ms | 1,420ms | 34.2% | 3 |
| 500 RPS | nRouter Gateway | 292ms | 372ms | 495ms | 0.0% | 0 |
| 1,000 RPS | Direct Upstream API | 520ms | 1,180ms | 2,850ms | 52.8% | 19 |
| 1,000 RPS | nRouter Gateway | 304ms | 395ms | 530ms | 0.0% | 0 |
| 2,500 RPS | Direct Upstream API | 740ms | 1,890ms | 4,600ms | 68.1% | 84 |
| 2,500 RPS | nRouter Gateway | 318ms | 420ms | 590ms | 0.0% | 0 |
At 1,000 RPS, direct API callers suffer from significant tail latency: p99 latency degrades to 2,850ms, with over half of all requests paying for fresh TCP/TLS connection setups and 19 requests dropping due to ephemeral port exhaustion.
In contrast, routing through the nRouter gateway holds p99 latency to 530ms—a 5.3x tail latency reduction. Because the gateway multiplexes traffic across established HTTP/2 pipes, zero cold starts occur, and socket error rates remain strictly at zero.
For a deeper exploration of percentile distributions and tail variance analysis, consult our guide on LLM Latency: p50, p95, p99, and Time-to-First-Token.
Edge cases we had to decide in production
Operating long-lived HTTP/2 connection pools against multiple independent cloud providers exposes edge cases that standard API proxies fail to handle. Here are four critical production challenges and how we resolved them:
1. Handling Upstream GOAWAY Frames During Provider Rolling Deploys
Problem: Cloud model providers frequently deploy new edge container revisions, signaling connection termination by transmitting an HTTP/2 GOAWAY frame. Naive proxies that attempt to dispatch new streams onto a connection after receiving a GOAWAY frame trigger immediate transport reset errors (ERR_HTTP2_GOAWAY_ALREADY_SENT), causing customer requests to fail.
Decision: When a GOAWAY frame is received on an active connection, we immediately mark the connection as non-allocatable for new streams, allow existing in-flight streams to drain gracefully up to the indicated last_stream_id, and concurrently initiate a fresh pre-warmed connection. This guarantees zero request drops during provider deployments.
2. Provider Idle Keep-Alive Timeouts vs Gateway Heartbeats
Problem: Upstream providers enforce varying, undocumented idle connection timeouts (e.g., Azure Key Vault closes idle sockets at 60 seconds; Anthropic edge endpoints close idle connections after 45 seconds). When a gateway attempts to write a prompt payload to a socket that the provider just closed, the packet is met with a TCP RST, resulting in a failed call.
Decision: When an active connection sits idle for more than 25 seconds, the gateway transmits an active HTTP/2 PING frame to verify socket viability; if the round-trip ack is not received within 1,200ms, the socket is purged from the pool. Sockets are retired proactively at 35 seconds of total age, well before any upstream provider initiates an uncoordinated TCP reset.
3. Stream Concurrency Ceilings per Physical Connection
Problem: The HTTP/2 specification allows servers to advertise SETTINGS_MAX_CONCURRENT_STREAMS (typically 100 or 250 streams per connection). If a gateway attempts to multiplex 300 concurrent requests over a single connection, the provider's HTTP/2 parser abruptly closes the session, failing all 300 requests at once.
Decision: When an active connection reaches 75% of its advertised maximum concurrent stream limit, the pool allocator dynamically spawns a parallel TCP connection. This creates a dynamic connection stripe, allowing load to distribute seamlessly across multiple multiplexed sessions without ever violating provider stream constraints.
4. Dynamic Provider Failover Without Client Interruption
Problem: If an upstream provider suffers a sudden regional outage, requests routed to that provider's warm pool will stall until transport timeouts fire (often 30+ seconds).
Decision: When consecutive connection errors or HTTP 5xx responses exceed our circuit-breaker error rate threshold on an active pool, the gateway trips the circuit and re-routes pending streams to the next designated fallback provider in under 5 milliseconds. Readers can review the algorithmic mechanics of our failover hierarchy in Provider Fallback Chains: Surviving an OpenAI Outage.
What you see from the outside: telemetry and headers
Transparency is central to nRouter's operational philosophy. The gateway exposes comprehensive timing and routing metadata on every HTTP response, enabling engineering teams to trace request execution with microsecond precision:
HTTP/1.1 200 OK
content-type: text/event-stream
x-nr-request-id: req_94ad8dcd_01927f5c
x-nr-model: openai/gpt-4o-mini
x-nr-routing: direct
x-nr-latency-ms: 284.57
x-nr-request-cost: $0.000142x-nr-request-id: The authoritative identifier correlating the edge request with audit logs, OTLP distributed traces, and spend settlement records.x-nr-model: The canonical model identifier served by the gateway.x-nr-routing: The routing strategy applied (e.g.direct,fallback,intent,latency).x-nr-latency-ms: The total elapsed duration measured by the gateway proxy engine.x-nr-request-cost: The exact list-price cost of the served model.
By monitoring x-nr-latency-ms in your OpenTelemetry collectors, you can definitively prove gateway performance SLOs and detect any upstream network degradation.
Limits of connection pooling
While warm HTTP/2 pooling dramatically accelerates transport and eliminates connection tail latency, connection pooling cannot alter fundamental physical and computational constraints:
- Physical Speed of Light Across Geos: A warm connection between a gateway in northern Virginia (
us-east-1) and a provider endpoint in Dublin (eu-west-1) cannot bypass trans-Atlantic fiber transit latency (~70ms round-trip). Enterprise deployments demanding minimum physical latency should deploy gateway clusters colocated in the same cloud region as their primary compute clusters via Enterprise VPC deployment options. - Model Computation and Queue Delay: If an upstream model is overloaded or generating complex chain-of-thought tokens, the provider's internal queue time will dominate the overall response latency. Connection pooling optimizes the wire; it cannot speed up the provider's GPU matrix multiplication.
- HTTP/2 TCP Head-of-Line Blocking on Packet Loss: Under severe network packet loss (>2%), all multiplexed streams on a single TCP connection may experience temporary stalls while the lost TCP segment is retransmitted. For environments where public internet packet loss is a concern, future transport iterations will leverage HTTP/3 (QUIC over UDP) to decouple stream packet loss entirely.
Frequently asked questions
Does routing requests through nRouter add latency compared to direct API calls?
No. For the majority of production workloads, nRouter reduces overall latency. While the gateway engine introduces between 4ms and 12ms of internal processing overhead, its persistent, pre-warmed HTTP/2 connection pools eliminate the 120ms to 380ms cold TCP/TLS handshake penalties inherent in unpooled direct calls. In high-concurrency benchmarks, p99 tail latency drops from 2,850ms to 530ms.
How does HTTP/2 multiplexing differ from standard HTTP keep-alive?
Standard HTTP/1.1 keep-alive keeps a TCP socket open, but only allows one active request at a time; concurrent requests require opening multiple separate TCP connections. HTTP/2 multiplexing allows hundreds of concurrent requests and streaming responses to share a single long-lived TCP connection simultaneously via interleaved frames, eliminating socket starvation and connection exhaustion.
What happens if an upstream provider closes a pooled connection abruptly?
The gateway maintains proactive health probes (PING frames) and tracks provider-specific idle timeout windows. If a connection receives a GOAWAY frame or is severed, in-flight streams are failed over to standby connections or designated fallback models within 5 milliseconds, ensuring that client applications experience zero dropped requests.
How are rate limits and spend quotas enforced without adding database latency?
Rate limits (RPM/TPM) and customer credit balances are evaluated in-memory using atomic lock-free data structures and lease synchronization. Key authentication, ACL verification, and budget checks execute in under 1 millisecond, completely bypassing disk and database bottlenecks on the critical request path.
Can enterprise customers deploy warm connection pooling in their own cloud VPC?
Yes. Organizations with strict data residency, security, or ultra-low latency requirements can deploy dedicated, private nRouter gateway instances directly inside their own AWS, Azure, or GCP virtual private clouds via nRouter Enterprise.
Try it
Experience sub-15ms gateway routing on your own workloads:
- Create an API Key: Sign up for an account at app.nrouter.ai/signup to generate your unified virtual key in seconds.
- Explore Supported Models: Browse flat list prices and latency benchmarks across 40+ providers on Models.
- Deploy Enterprise Tenancy: Discuss dedicated VPC infrastructure, private peering, and customized connection topologies with our team via nRouter Enterprise.
See also
- LLM Latency: p50, p95, p99, and Time-to-First-Token — how to decouple time-to-first-token from generation duration.
- Provider Fallback Chains: Surviving an OpenAI Outage — automated multi-provider failover without client connection drops.
- RPM and TPM Rate Limiting Per Key, Team, and Org — protecting model allocations from traffic spikes.
- Write-Time PII Redaction in LLM Logs, Without Losing Debug Detail — sanitizing sensitive tokens before log persistence.
- Reserve-and-Settle: Never Overspend a Credit Balance — zero credit leaks and atomic list-price spend settlement.
- Flat Provider Pricing Catalog — zero per-token markup and transparent platform fee breakdown.
- nRouter Enterprise Infrastructure — dedicated tenancy, VPC peering, and private gateway clusters.
Sources
Verified 2026-09-27; if any specification has drifted, email hello@nrouter.ai.
- IETF HTTP/2 Specification (RFC 9113): datatracker.ietf.org/doc/html/rfc9113
- IETF QUIC Transport Protocol (RFC 9000): datatracker.ietf.org/doc/html/rfc9000
- Linux TCP Connection Management: man7.org/linux/man-pages/man7/tcp.7.html
- OpenAI API Edge Performance Documentation: platform.openai.com/docs/guides/production-best-practices
- Anthropic API Latency Recommendations: docs.anthropic.com/en/api/overview