

Dashboard
Explore the nRouter dashboard console. Manage virtual keys, inspect request lifecycles, configure routing, set guardrails, and track billing.
Last updated
The nRouter Dashboard (app.nrouter.ai) is your command center for AI gateway operations. It provides centralized controls for provisioning virtual API keys, inspecting real-time request lifecycles, configuring smart routing strategies, enforcing safety guardrails, and managing prepaid credits.
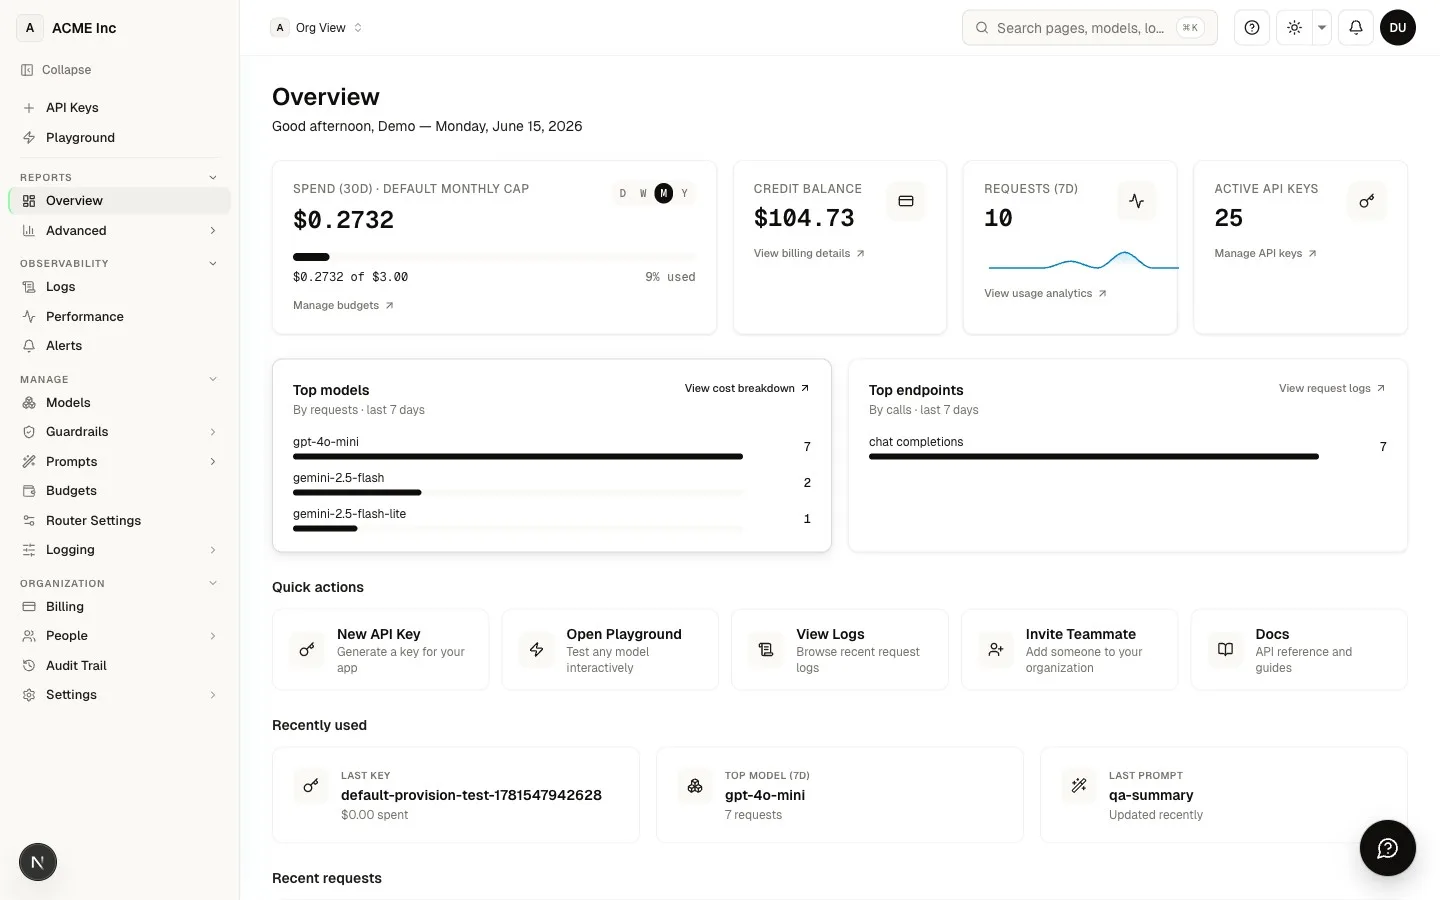
Overview metrics
The organization overview page (/[organization]) provides high-level observability across your AI traffic, usage trends, and system health.
Core telemetry cards
- Token throughput: Total tokens processed across all models, with dedicated breakdowns for input tokens, output tokens, provider prompt cache reads, and reasoning tokens.
- Settled spend: Total dollar spend calculated at exact provider list prices. If a provider's cost is unavailable at settlement time, the request is marked
Unpricedrather than assuming zero cost. - Latency performance: Real-time request latency tracking, highlighting both end-to-end gateway turnaround and upstream provider time-to-first-token or time-to-response-headers.
- Active virtual keys: Count of active
sk-nrouter-*keys currently authorized to route requests. - Budget utilization: Current billing cycle consumption measured against configured organization or team spending caps.
Virtual Keys (sk-nrouter-*)
nRouter decouples your application clients from direct upstream provider accounts using Virtual Keys. Application services authenticate against the edge gateway using an sk-nrouter-* token, allowing you to enforce policies, rate limits, and budgets without rotating keys across downstream providers.
![API Keys dashboard at /[organization]/keys — virtual key management](/_next/static/media/dashboard-keys.3w2myt362bzda.webp)
Key provisioning and security
Navigate to /[organization]/keys to create and configure virtual keys. When creating a key:
- One-time secret display: The plaintext secret
sk-nrouter-...is presented exactly once upon creation. In accordance with security standards, the gateway hashes keys using SHA-256; the dashboard only ever displays the key alias and the last four characters (sk-...last4). - Team assignment: Every virtual key is bound to exactly one team within your organization, inheriting that team's access controls and guardrail rules.
- Per-key spending budgets: Set hard spending caps or soft alert thresholds. When a key approaches a soft threshold, responses include the
x-nr-budget-warningheader. When a hard limit is reached, subsequent requests return an HTTP 402 status code. - Model scoping: Specify an explicit allowlist of models (e.g.
openai/gpt-4o,anthropic/claude-3-5-sonnet,google/gemini-2.5-pro). An empty allowlist inherits the team's full model catalog. Requests targeting unauthorized models are rejected at preflight before dispatch. - Allowed endpoints: Restrict the key to specific API capabilities, such as
/v1/chat/completions,/v1/embeddings, or/v1/images/generations. - Throughput rate limits: Define granular rate controls per key:
- RPM (Requests Per Minute): Sliding-window request rate limit.
- TPM (Tokens Per Minute): Sliding-window token throughput ceiling.
- IP allowlists: Restrict access to designated CIDR network blocks. Calls originating from non-whitelisted IP addresses return HTTP 401.
- Expiration policies: Set keys to expire after 30 days, 90 days, at a custom UTC timestamp, or retain them indefinitely.
Request Debug & Trace Canvas
The Request Debug & Trace Canvas provides deep, Apigee-style execution tracing for every request flowing through the Rust gateway. Accessible via the Trace action in the request logs table (/[organization]/logs) or via deep links (?trace=<request_id>), the canvas visualizes each step of the inference pipeline.
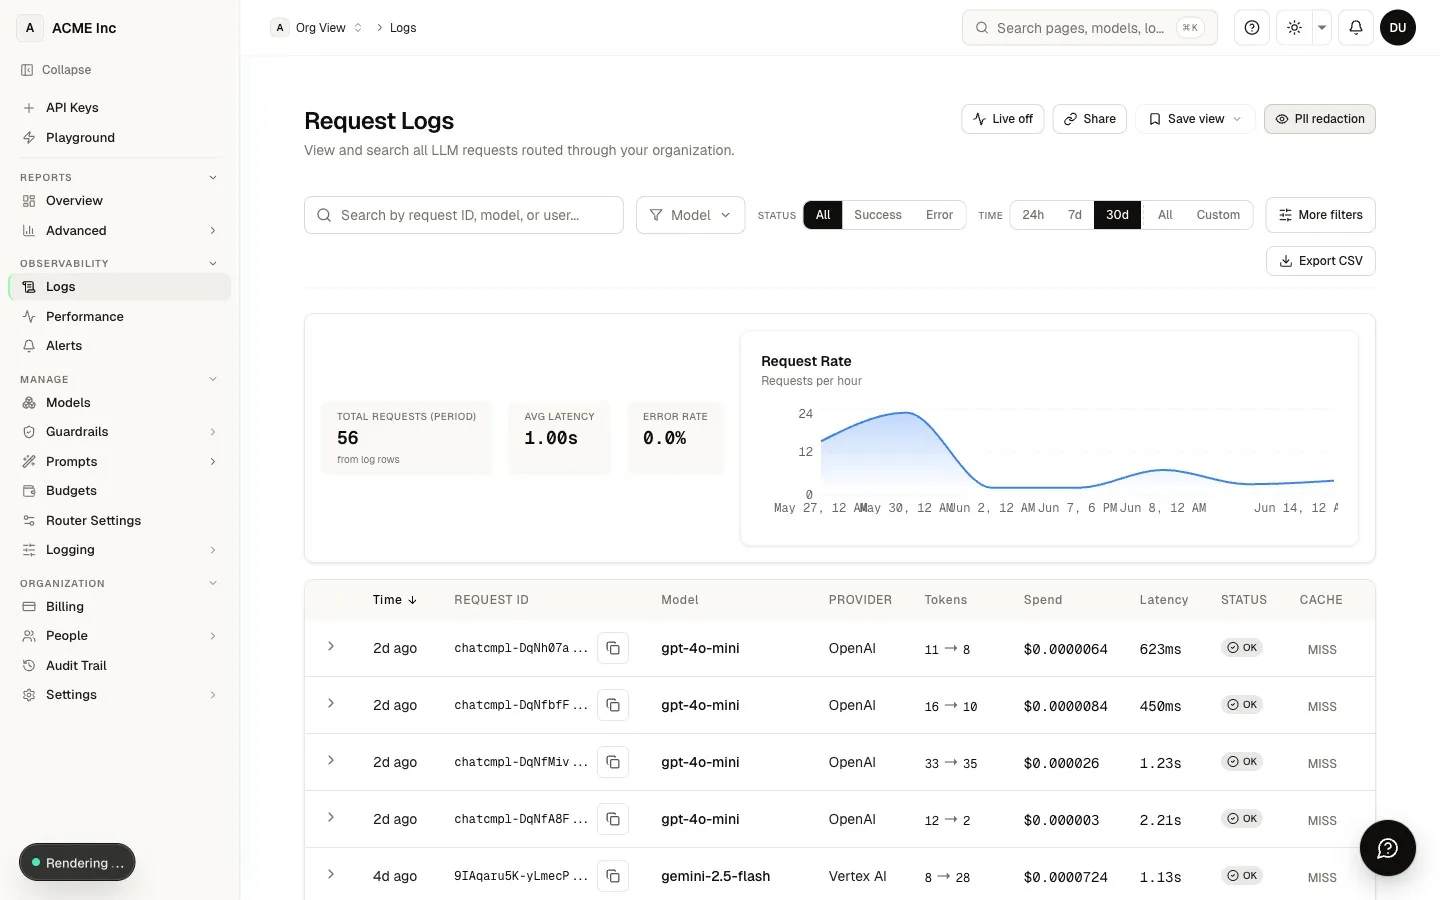
The canvas provides two complementary visual series:
Series 1: Pipeline Canvas
The Pipeline Canvas is an interactive workflow node graph rendered on a dot-grid background. It visualizes the end-to-end execution path across sequential gates and concurrent evaluation chambers:
- Sequential Gate Nodes: Clear step cards (e.g., Ingress, Auth, Credit Reservation, Routing, Upstream Call, Settlement) showing execution order, status pills, and transition metrics.
- Concurrent Fork/Join Chambers: For preflight inspection, parallel checks are organized into concurrent branches:
- 03A AI Safety & Security Scan: Content moderation and prompt injection detection evaluated via sidecar scoring.
- 03B Throughput & RPM/TPM Ceiling: Tenant and key-level sliding window rate limits.
- 03C Tenant Model ACL & Org Restriction: Access control validation against organization-level policies.
- Connection Ports and Pulse Indicators: Nodes feature distinct anchor ports linked by directional pulse lines indicating live request flow. Bypassed downstream steps (such as downstream provider calls after a preflight refusal) are visibly dimmed.
Series 2: Timeline Gantt Waterfall
The Timeline Trace (Gantt) view provides a timing breakdown:
- Latency Composition Bar: Visualizes critical path duration, separating the upstream provider response time from gateway preflight and postflight processing.
- Waterfall Grid: Step rows measured along a millisecond timeline with interactive scrubber hairlines.
- Key Trace Milestones: Highlights critical lifecycle timestamps:
T0: Ingress received.Credit Hold: Reservation placed.Upstream Provider Dispatched: Wire request dispatched to model provider.Egress Settled & Closed: Final response delivered and spend committed.
Apigee-style stage inspection
Selecting any stage card in either view opens a detailed stage inspector beneath the canvas:
- Overview & Logic: Concise summary of stage evaluation results and decision criteria.
- Parameters: Structured 3-column key/value grid displaying relevant runtime attributes (e.g., detected tokens, model wire adapter, HTTP status codes).
- Raw Diagnostic JSON: Sanitized JSON diagnostic payload with one-click copy. Sensitive dimensions and PII are redacted based on the user's role permissions.
Auto Router settings
Configure intelligent traffic steering under /[organization]/router-settings. Rather than binding clients to a single static model, you can expose smart router aliases (such as nrouter/auto or custom alias names) that dynamically resolve to optimal candidates.
Latency vs. cost optimization
Choose from multiple algorithmic strategies:
- Cost Optimization: Evaluates candidates against real-time list prices from the active model catalog, ranking models by combined input and output pricing per million tokens.
- Latency Optimization: Selects the fastest candidate using exponential weighted moving averages (EWMA) of observed response latencies.
- Priority Failover: Tries models in a strict, pre-configured sequence.
- Weighted Distribution: Distributes traffic across models according to percentage weights using request-ID-seeded rendezvous hashing.
Light vs. heavy tiering (Intent routing)
When using intent-based routing, incoming prompts are classified into 11 distinct intent categories:
- Light Tiers (
chitchat,simple_qa,summarization,translation,classification): Automatically routed to ultra-fast, cost-effective small and medium models. - Heavy Tiers (
code,reasoning,math,data_extraction,creative_writing,agentic): Automatically directed to frontier high-parameter models and reasoning engines.
import { nRouter } from "@nrouter_ai/sdk";

const client = new nRouter();

// The router evaluates prompt intent and chooses between light and heavy tiers
const completion = await client.chat.completions.create({
  model: "nrouter/auto",
  messages: [{ role: "user", content: "Write a high-performance Rust parser for JSON lines." }],
});

console.log("Served by:", completion.model);
Zero-cost fallback guarantees
Fallback retries only trigger on non-billable upstream refusals: HTTP 429 (rate limit), HTTP 503 (service unavailable), Anthropic 529 (overloaded), or connect-phase network drops. If an upstream provider begins generating tokens or returns an application error, nRouter stops the chain immediately to eliminate the risk of duplicate billing.
Guardrails & Safety
The Guardrails console (/[organization]/guardrails) lets you configure real-time content filtering and security checks applied before a prompt reaches a model (pre-call) and before a response reaches your users (post-call).
![Guardrails dashboard at /[organization]/guardrails — pre-call and post-call safety rules](/_next/static/media/dashboard-guardrails.16dwob7ugbnp5.webp)
Security controls
- PII Redaction: Automatically detects and redacts sensitive data (such as emails, telephone numbers, Social Security numbers, and credit card patterns) using Microsoft Presidio integration.
- Prompt Injection Defense: Scans incoming inputs for jailbreak attempts, adversarial overrides, and instruction hijacking.
- Moderation Scoring: Screens text for hate speech, harassment, sexual content, and self-harm violations using specialized scoring models.
Action modes and billing impact
Guardrail policies support multiple operational modes:
| Action Mode | Behavior | Billing Outcome |
|---|---|---|
| Block | Immediately stops the request and returns an HTTP 400 refusal. | $0 spend: Credit reservation is fully released. |
| Redact | Anonymizes sensitive text in-flight before forwarding to provider or client. | Request continues and settles normally. |
| Monitor | Evaluates content and logs telemetry without altering or blocking traffic. | Normal execution. |
The gateway reports pre-call guardrail posture through the x-nr-guardrails header (none, monitor, pass, redacted, or blocked).
Billing & Credits
Manage your credits and billing under /[organization]/billing. nRouter sells one plan: Pay as you go. Subscription plans are not offered to new customers; existing subscribers keep their plan and its allowance.
![Billing dashboard at /[organization]/billing — available credits and plan management](/_next/static/media/dashboard-billing.0zby02bofagpi.webp)
Funding model
-
Prepaid Credits (Pay as you go):
- Covers all models across the full catalog, including
nrouter/auto. - Every request places an atomic credit reservation at preflight, executes against the provider, and settles at exact model list price upon completion.
- Any unused reservation is immediately released. Balance never drops below zero.
- Platform fee: 0% platform fee. A credit purchase charges exactly the credits bought ($5 costs $5.00, $100 costs $100.00) with no fee on top.
- Covers all models across the full catalog, including
-
Subscription Usage Allowances (Existing subscribers):
- Existing monthly subscription plans retain their dedicated dollar allowances for requests routed through
nrouter/auto. - Window Pacing: Allowances are metered across sub-windows (8-hour, daily, weekly, and monthly caps).
- Responses report the funding mechanism via
x-nr-funding-source(allowanceorcredits) and indicate window recovery viax-nr-allowance-reset.
- Existing monthly subscription plans retain their dedicated dollar allowances for requests routed through
Stripe Checkout & Customer Portal
Top up credits instantly from $5 to $25,000 per transaction via Stripe Checkout. Organization Owners and Org Admins can configure Auto top-up thresholds to replenish balances automatically when credits fall below a chosen balance floor. Manage invoices, download PDF receipts, and update payment methods through the embedded Stripe Customer Portal.
Answer Inspector
The Answer Inspector is an interactive diagnostic drawer designed to trace retrieval-augmented generation (RAG) queries, support agent conversations, and automated assistant turns.
Verified Metadata Strip
The top ribbon displays verified runtime telemetry:
- Serving Model: Concrete model identifier that served the final output (e.g.
gpt-4o,claude-3-5-sonnet). - Routing Chain: The resolution path followed (e.g.
nrouter/auto -> gpt-4o). - Latency: End-to-end execution duration in milliseconds.
- Cost: Exact settled transaction cost in USD, or
Unpricedif upstream cost data was unavailable.
The 7-Stage Execution Timeline
The Answer Inspector traces request execution through seven verifiable stages:
[01 Ingress & Auth] ──► [02 Workspace Routing] ──► [03 Cache Check] ──► [04 Knowledge Retrieval]
                                                                                │
[07 Citations & Settlement] ◄── [06 Model Inference] ◄── [05 Gateway Preflight] ◄┘- 01 Ingress & Session Auth: Validates stateless caller credentials and verifies request origin.
- 02 Workspace & Support Line Routing: Resolves isolated organization workspaces and binds agent routing configurations.
- 03 Response Cache Check: Computes composite cache keys (tenant, release, query hash) to serve cached responses when available.
- 04 Knowledge Retrieval & Grounding: Executes pgvector cosine similarity searches over grounded knowledge bases to assemble relevant context chunks.
- 05 Gateway Preflight & Reservation: Checks rate limits, applies safety holds, and places a two-tier credit or allowance reservation.
- 06 Model Inference & Routing Chain: Dispatches contextual prompt to the selected model or routing alias.
- 07 Citations, Guardrails & Settlement: Performs output PII redaction, extracts ground truth source citations, and settles spend at exact list price.
Citations and source inspection
The Citations tab details all source materials used in the generated response, including chunk IDs, similarity match percentages, document titles, and excerpted grounding text. The Raw JSON tab provides complete diagnostic inspection for debugging and compliance audits.
Next steps
- API Key Management — Rotate and manage virtual key credentials
- Router Settings — Configure customized smart routing models
- Observability & Logs — Analyze request logs and export CSV telemetry